En este manual veremos como monitorizar los emails enviados/recibidos y el estado de las colas en un servidor de correo SendMail mediante Prometheus, si no hemos realizado la instalación base de Prometheus primer seguiremos la guía básica de instalación de Prometheus y Grafana.
El primer paso será habilitar las stats de
SendMail:
cd /etc/mail
Generamos el fichero de configuración:
Lo editamos:
define(`STATUS_FILE',`/var/log/sendmail.stats')dnl
Compilamos la configuración y la aplicamos:
cp HOSTNAME.cf sendmail.cf
Reiniciamos el servicio:
Ahora mediante el siguiente comando podemos obtener las estadísticas:
Statistics from Tue Jan  3 18:22:55 2023
 M   msgsfr  bytes_from   msgsto    bytes_to  msgsrej msgsdis msgsqur  Mailer
=====================================================================
 T        0          0K        0          0K        0       0       0
 C        0                    0                    0
Si enviamos un email desde el servidor SendMail veremos la siguiente salida:
Statistics from Tue Jan  3 18:23:34 2023
 M   msgsfr  bytes_from   msgsto    bytes_to  msgsrej msgsdis msgsqur  Mailer
 3        1          1K        0          0K        0       0       0  local
 5        0          0K        1          2K        0       0       0  esmtp
=====================================================================
 T        1          1K        1          2K        0       0       0
 C        1                    1                    0
Observamos que el mail se genera desde local(msgsfr) a esmtp(msgsto)
Si recibimos un email en el servidor SendMail veremos la siguiente salida:
Statistics from Tue Jan  3 18:23:34 2023
 M   msgsfr  bytes_from   msgsto    bytes_to  msgsrej msgsdis msgsqur  Mailer
 3        1          1K        1          5K        0       0       0  local
 5        1          4K        1          2K        0       0       0  esmtp
=====================================================================
 T        2          5K        2          7K        0       0       0
 C        2                    2                    0
Observamos que el mail se genera desde esmtp(msgsfr) a local(msgsto)
Las dos útlimas filas son los Totales: T que a mi parecer teniendo los parciales no tiene sentido mostrarlos y los mensajes enviados por conexión TCP que tampoco le veo sentido.
- connectionMessagesFrom: Number of messages sent over TCP connections.
- connectionMessagesTo: Number of messages received over TCP connections.
- connectionMessagesRejected: Number of messages that arrived over TCP connections and were rejected.
Por lo tanto para la monitorización de emails enviados y tráfico entrante/saliente debemos obtener los siguientes campos.
- Emisión:
Aumento esmtp(msgsto)
Aumento esmtp(bytes_to)
- Recepción:
Aumento local(msgsto)
Aumento local(bytes_to)
Otra métrica interesante es el tamaño de la cola del servidor SMTP, observar un email encolado en un sistema idle es complicado, así que definiremos una regla a nivel de firewall donde permitiremos la entrada del email pero no las salida de este modo el email quedará encolado:
ipfw add 00011 deny tcp from any to any 25
Consultamos la cola:
		/var/spool/mqueue (1 request)
-----Q-ID----- --Size-- -----Q-Time----- ------------Sender/Recipient-----------
19DAkLMh052596      575 Tue Jan 03 18:46 <kr0m@alfaexploit.com>
                 (Deferred: Permission denied)
					 <jjivarspoquet@gmail.com>
		Total requests: 1
Borramos la regla de firewall y vemos que ya no hay mails encolados:
ipfw delete 00011
/var/spool/mqueue is empty
		Total requests: 0
Sendmail procesa los mails en colas distintas dependiendo del origen de estos, las colas por defecto son:
- Cola mqueue: El mail fué introducido en el sistema por un proceso corriendo como root, suelen ser los emails de entrada, estos emails podemos encontrarlos en /var/spool/mqueue/
- Cola clientmqueue: El mail fué introducido en el sistema por cualquier otro usuario distinto a root, suelen ser mails enviados por usuarios regulares del sistemas, estos emails podemos encontrarlos en /var/spool/clientmqueue(path definido en /etc/mail/submit.cf)
NOTA: Yo no he conseguido de ninguna manera encolar mails en la cola clientmqueue, desconozco en que caso se dará dicho escenario.
Además en cada una de las colas pueden haber mails en distintos estados:
- lost: Son los mails que tras varios intentos no se han podido entregar por alguna razón.
- quarantined: Son los mails que por alguna razón han quedado en cuarentena, esto puede ocurrir por alguna regla definida a nivel de SendMail o por algún milter como SpamAssassin por ejemplo.
Mailq nos permite visuarlizar las distintas colas y estados según los argumentos que le pasemos:
- Sin argumentos: Muestra la cola mqueue
- -Ac: Muestra la cola clientmqueue
- -qL: Muestra los mails lost
- -qQ: Muestra los mails quarantined
Ahora que ya sabemos consultar los datos manualmente vamos a proceder con la programación de nuestro exporter, lo primero es decidir que tipo de métricas vamos a servir en mi caso serán todo Gauges:
- Emails enviados/recibidos
- Bytes enviados/recibidos
- Email encolados por cola/estado
Compilamos el exporter:
cd sendmailExporter
go mod init sendmailExporter
package main
import (
	"bufio"
	"bytes"
	"fmt"
	"net"
	"net/http"
	"os/exec"
	"regexp"
	"strconv"
	"strings"
	"time"
	"github.com/prometheus/client_golang/prometheus"
	"github.com/prometheus/client_golang/prometheus/promhttp"
)
var (
	// Metric definitions
	smtpIncomingEmails = prometheus.NewGauge(prometheus.GaugeOpts{
		Name: "smtp_incoming_emails", Help: "Incoming emails via SMTP: mailstats",
	})
	smtpIncomingData = prometheus.NewGauge(prometheus.GaugeOpts{
		Name: "smtp_incoming_data", Help: "Incoming Kbytes via SMTP: mailstats",
	})
	smtpIncomingRejected = prometheus.NewGauge(prometheus.GaugeOpts{
		Name: "smtp_incoming_rejected_emails", Help: "Rejected incoming emails via SMTP: mailstats",
	})
	smtpIncomingDiscarded = prometheus.NewGauge(prometheus.GaugeOpts{
		Name: "smtp_incoming_discarded_emails", Help: "Discarded incoming emails via SMTP: mailstats",
	})
	smtpIncomingQuarantined = prometheus.NewGauge(prometheus.GaugeOpts{
		Name: "smtp_incoming_quarantined_emails", Help: "Quarantined incoming emails via SMTP: mailstats",
	})
	smtpOutcomingEmails = prometheus.NewGauge(prometheus.GaugeOpts{
		Name: "smtp_outcoming_emails", Help: "outcoming emails via SMTP: mailstats",
	})
	smtpOutcomingData = prometheus.NewGauge(prometheus.GaugeOpts{
		Name: "smtp_outcoming_data", Help: "outcoming Kbytes via SMTP: mailstats",
	})
	smtpOutcomingRejected = prometheus.NewGauge(prometheus.GaugeOpts{
		Name: "smtp_outcoming_rejected_emails", Help: "Rejected outcoming emails via SMTP: mailstats",
	})
	smtpOutcomingDiscarded = prometheus.NewGauge(prometheus.GaugeOpts{
		Name: "smtp_outcoming_discarded_emails", Help: "Discarded outcoming emails via SMTP: mailstats",
	})
	smtpOutcomingQuarantined = prometheus.NewGauge(prometheus.GaugeOpts{
		Name: "smtp_outcoming_quarantined_emails", Help: "Quarantined outcoming emails via SMTP: mailstats",
	})
	smtpQueuedMqueue = prometheus.NewGauge(prometheus.GaugeOpts{
		Name: "smtp_queued_emails_mqueue", Help: "Queued emails: qmail",
	})
	smtpQueuedClient = prometheus.NewGauge(prometheus.GaugeOpts{
		Name: "smtp_queued_emails_clientmqueue", Help: "Queued emails: qmail -Ac",
	})
	smtpQueuedLost = prometheus.NewGauge(prometheus.GaugeOpts{
		Name: "smtp_queued_emails_lost", Help: "Queued emails: qmail -qL",
	})
	smtpQueuedQuarantined = prometheus.NewGauge(prometheus.GaugeOpts{
		Name: "smtp_queued_emails_quarantined", Help: "Queued emails: qmail -qQ",
	})
)
func init() {
	// Register metrics with Prometheus registry
	prometheus.MustRegister(smtpIncomingEmails)
	prometheus.MustRegister(smtpIncomingData)
	prometheus.MustRegister(smtpIncomingRejected)
	prometheus.MustRegister(smtpIncomingDiscarded)
	prometheus.MustRegister(smtpIncomingQuarantined)
	prometheus.MustRegister(smtpOutcomingEmails)
	prometheus.MustRegister(smtpOutcomingData)
	prometheus.MustRegister(smtpOutcomingRejected)
	prometheus.MustRegister(smtpOutcomingDiscarded)
	prometheus.MustRegister(smtpOutcomingQuarantined)
	prometheus.MustRegister(smtpQueuedMqueue)
	prometheus.MustRegister(smtpQueuedClient)
	prometheus.MustRegister(smtpQueuedLost)
	prometheus.MustRegister(smtpQueuedQuarantined)
}
// Helper to run mailq commands and parse the 'Total requests' field
func getMailqCount(args ...string) float64 {
	cmd := exec.Command("mailq", args...)
	out, err := cmd.Output()
	if err != nil {
		return 0
	}
	re := regexp.MustCompile(`.*Total requests:\s*(\d*)`)
	scanner := bufio.NewScanner(bytes.NewReader(out))
	for scanner.Scan() {
		match := re.FindStringSubmatch(scanner.Text())
		if len(match) > 1 {
			val, _ := strconv.ParseFloat(match[1], 64)
			return val
		}
	}
	return 0
}
func getSendmailStats() {
	fmt.Println("++ mainThread started")
	fmt.Println("------------------")
	// Pre-compile regex for matching mailstats output
	reLocal := regexp.MustCompile(`\s*\d*\s*\d*\s*\d*\s*(\d*)\s*(\d*)\s*(\d*)\s*(\d*)\s*(\d*)\s*local`)
	reEsmtp := regexp.MustCompile(`\s*\d*\s*\d*\s*\d*\s*(\d*)\s*(\d*)\s*(\d*)\s*(\d*)\s*(\d*)\s*esmtp`)
	for {
		now := time.Now().Format("2006-01-02 15:04:05.000000")
		fmt.Printf("%s\n\n", now)
		// 1. MAILSTATS collection
		cmd := exec.Command("mailstats", "-P")
		out, err := cmd.Output()
		if err == nil {
			lines := strings.Split(string(out), "\n")
			for _, line := range lines {
				// Parse local (Incoming) stats
				if match := reLocal.FindStringSubmatch(line); len(match) > 5 {
					v1, _ := strconv.ParseFloat(match[1], 64)
					v2, _ := strconv.ParseFloat(match[2], 64)
					v3, _ := strconv.ParseFloat(match[3], 64)
					v4, _ := strconv.ParseFloat(match[4], 64)
					v5, _ := strconv.ParseFloat(match[5], 64)
					fmt.Printf("> smtp_incoming_emails: %v\n", v1)
					smtpIncomingEmails.Set(v1)
					fmt.Printf("> smtp_incoming_data: %v\n", v2)
					smtpIncomingData.Set(v2)
					fmt.Printf("> smtp_incoming_rejected_emails: %v\n", v3)
					smtpIncomingRejected.Set(v3)
					fmt.Printf("> smtp_incoming_discarded_emails: %v\n", v4)
					smtpIncomingDiscarded.Set(v4)
					fmt.Printf("> smtp_incoming_quarantined_emails: %v\n\n", v5)
					smtpIncomingQuarantined.Set(v5)
				}
				// Parse esmtp (Outgoing) stats
				if match := reEsmtp.FindStringSubmatch(line); len(match) > 5 {
					v1, _ := strconv.ParseFloat(match[1], 64)
					v2, _ := strconv.ParseFloat(match[2], 64)
					v3, _ := strconv.ParseFloat(match[3], 64)
					v4, _ := strconv.ParseFloat(match[4], 64)
					v5, _ := strconv.ParseFloat(match[5], 64)
					fmt.Printf("> smtp_outcoming_emails: %v\n", v1)
					smtpOutcomingEmails.Set(v1)
					fmt.Printf("> smtp_outcoming_data: %v\n", v2)
					smtpOutcomingData.Set(v2)
					fmt.Printf("> smtp_outcoming_rejected_emails: %v\n", v3)
					smtpOutcomingRejected.Set(v3)
					fmt.Printf("> smtp_outcoming_discarded_emails: %v\n", v4)
					smtpOutcomingDiscarded.Set(v4)
					fmt.Printf("> smtp_outcoming_quarantined_emails: %v\n\n", v5)
					smtpOutcomingQuarantined.Set(v5)
				}
			}
		}
		// 2. Collection from various MAILQ commands
		q1 := getMailqCount()
		fmt.Printf("> smtp_queued_emails_mqueue: %v\n", q1)
		smtpQueuedMqueue.Set(q1)
		q2 := getMailqCount("-Ac")
		fmt.Printf("> smtp_queued_emails_clientmqueue: %v\n", q2)
		smtpQueuedClient.Set(q2)
		q3 := getMailqCount("-qL")
		fmt.Printf("> smtp_queued_emails_lost: %v\n", q3)
		smtpQueuedLost.Set(q3)
		q4 := getMailqCount("-qQ")
		fmt.Printf("> smtp_queued_emails_quarantined: %v\n", q4)
		smtpQueuedQuarantined.Set(q4)
		fmt.Println("------------------")
		time.Sleep(30 * time.Second)
	}
}
// basicAuth Middleware for protecting the /metrics endpoint
func basicAuth(next http.Handler) http.Handler {
	return http.HandlerFunc(func(w http.ResponseWriter, r *http.Request) {
		user, pass, ok := r.BasicAuth()
		if !ok || user != "sendmail_exporter_user" || pass != "XXXXXXXXXXXXXXXXXXX" {
			w.Header().Set("WWW-Authenticate", `Basic realm="metrics"`)
			w.WriteHeader(http.StatusUnauthorized)
			w.Write([]byte("401 Unauthorized\n"))
			return
		}
		// Console logging for request tracking
		now := time.Now().Format("2006-01-02 15:04:05.000000")
		srcIP, _, _ := net.SplitHostPort(r.RemoteAddr)
		fmt.Printf("\n< Serving metrics: %s - %s\n\n", srcIP, now)
		next.ServeHTTP(w, r)
	})
}
func main() {
	// Start background metric collection goroutine
	go getSendmailStats()
	// Configure HTTP routes
	mux := http.NewServeMux()
	mux.Handle("/metrics", basicAuth(promhttp.Handler()))
	fmt.Println("Server listening on 0.0.0.0:2525")
	if err := http.ListenAndServe(":2525", mux); err != nil {
		fmt.Printf("Fatal error: %v\n", err)
	}
}
NOTA: Recordad que si instalamos el exporter en el host padre de un servidor de jails deberemos bindearlo solo a su ip en concreto ya que si no lo hacemos así ocupará las ips de todas las jails.
Compilamos y copiamos el binario al sistema:
cp sendmailExporter /usr/local/bin/
Lo ejecutamos manualmente para asegurarnos de que no falla:
Consultamos las métricas manualmente:
# HELP go_gc_duration_seconds A summary of the wall-time pause (stop-the-world) duration in garbage collection cycles.
# TYPE go_gc_duration_seconds summary
go_gc_duration_seconds{quantile="0"} 0.000335967
go_gc_duration_seconds{quantile="0.25"} 0.000375586
go_gc_duration_seconds{quantile="0.5"} 0.000399737
go_gc_duration_seconds{quantile="0.75"} 0.000420252
go_gc_duration_seconds{quantile="1"} 0.001975418
go_gc_duration_seconds_sum 0.178386612
go_gc_duration_seconds_count 426
# HELP go_gc_gogc_percent Heap size target percentage configured by the user, otherwise 100. This value is set by the GOGC environment variable, and the runtime/debug.SetGCPercent function. Sourced from /gc/gogc:percent.
# TYPE go_gc_gogc_percent gauge
go_gc_gogc_percent 100
# HELP go_gc_gomemlimit_bytes Go runtime memory limit configured by the user, otherwise math.MaxInt64. This value is set by the GOMEMLIMIT environment variable, and the runtime/debug.SetMemoryLimit function. Sourced from /gc/gomemlimit:bytes.
# TYPE go_gc_gomemlimit_bytes gauge
go_gc_gomemlimit_bytes 9.223372036854776e+18
# HELP go_goroutines Number of goroutines that currently exist.
# TYPE go_goroutines gauge
go_goroutines 8
# HELP go_info Information about the Go environment.
# TYPE go_info gauge
go_info{version="go1.24.13"} 1
# HELP go_memstats_alloc_bytes Number of bytes allocated in heap and currently in use. Equals to /memory/classes/heap/objects:bytes.
# TYPE go_memstats_alloc_bytes gauge
go_memstats_alloc_bytes 3.039864e+06
# HELP go_memstats_alloc_bytes_total Total number of bytes allocated in heap until now, even if released already. Equals to /gc/heap/allocs:bytes.
# TYPE go_memstats_alloc_bytes_total counter
go_memstats_alloc_bytes_total 5.9623328e+08
# HELP go_memstats_buck_hash_sys_bytes Number of bytes used by the profiling bucket hash table. Equals to /memory/classes/profiling/buckets:bytes.
# TYPE go_memstats_buck_hash_sys_bytes gauge
go_memstats_buck_hash_sys_bytes 3666
# HELP go_memstats_frees_total Total number of heap objects frees. Equals to /gc/heap/frees:objects + /gc/heap/tiny/allocs:objects.
# TYPE go_memstats_frees_total counter
go_memstats_frees_total 1.990489e+06
# HELP go_memstats_gc_sys_bytes Number of bytes used for garbage collection system metadata. Equals to /memory/classes/metadata/other:bytes.
# TYPE go_memstats_gc_sys_bytes gauge
go_memstats_gc_sys_bytes 2.641416e+06
# HELP go_memstats_heap_alloc_bytes Number of heap bytes allocated and currently in use, same as go_memstats_alloc_bytes. Equals to /memory/classes/heap/objects:bytes.
# TYPE go_memstats_heap_alloc_bytes gauge
go_memstats_heap_alloc_bytes 3.039864e+06
# HELP go_memstats_heap_idle_bytes Number of heap bytes waiting to be used. Equals to /memory/classes/heap/released:bytes + /memory/classes/heap/free:bytes.
# TYPE go_memstats_heap_idle_bytes gauge
go_memstats_heap_idle_bytes 3.52256e+06
# HELP go_memstats_heap_inuse_bytes Number of heap bytes that are in use. Equals to /memory/classes/heap/objects:bytes + /memory/classes/heap/unused:bytes
# TYPE go_memstats_heap_inuse_bytes gauge
go_memstats_heap_inuse_bytes 4.276224e+06
# HELP go_memstats_heap_objects Number of currently allocated objects. Equals to /gc/heap/objects:objects.
# TYPE go_memstats_heap_objects gauge
go_memstats_heap_objects 2884
# HELP go_memstats_heap_released_bytes Number of heap bytes released to OS. Equals to /memory/classes/heap/released:bytes.
# TYPE go_memstats_heap_released_bytes gauge
go_memstats_heap_released_bytes 3.203072e+06
# HELP go_memstats_heap_sys_bytes Number of heap bytes obtained from system. Equals to /memory/classes/heap/objects:bytes + /memory/classes/heap/unused:bytes + /memory/classes/heap/released:bytes + /memory/classes/heap/free:bytes.
# TYPE go_memstats_heap_sys_bytes gauge
go_memstats_heap_sys_bytes 7.798784e+06
# HELP go_memstats_last_gc_time_seconds Number of seconds since 1970 of last garbage collection.
# TYPE go_memstats_last_gc_time_seconds gauge
go_memstats_last_gc_time_seconds 1.772358202308302e+09
# HELP go_memstats_mallocs_total Total number of heap objects allocated, both live and gc-ed. Semantically a counter version for go_memstats_heap_objects gauge. Equals to /gc/heap/allocs:objects + /gc/heap/tiny/allocs:objects.
# TYPE go_memstats_mallocs_total counter
go_memstats_mallocs_total 1.993373e+06
# HELP go_memstats_mcache_inuse_bytes Number of bytes in use by mcache structures. Equals to /memory/classes/metadata/mcache/inuse:bytes.
# TYPE go_memstats_mcache_inuse_bytes gauge
go_memstats_mcache_inuse_bytes 2416
# HELP go_memstats_mcache_sys_bytes Number of bytes used for mcache structures obtained from system. Equals to /memory/classes/metadata/mcache/inuse:bytes + /memory/classes/metadata/mcache/free:bytes.
# TYPE go_memstats_mcache_sys_bytes gauge
go_memstats_mcache_sys_bytes 15704
# HELP go_memstats_mspan_inuse_bytes Number of bytes in use by mspan structures. Equals to /memory/classes/metadata/mspan/inuse:bytes.
# TYPE go_memstats_mspan_inuse_bytes gauge
go_memstats_mspan_inuse_bytes 55040
# HELP go_memstats_mspan_sys_bytes Number of bytes used for mspan structures obtained from system. Equals to /memory/classes/metadata/mspan/inuse:bytes + /memory/classes/metadata/mspan/free:bytes.
# TYPE go_memstats_mspan_sys_bytes gauge
go_memstats_mspan_sys_bytes 65280
# HELP go_memstats_next_gc_bytes Number of heap bytes when next garbage collection will take place. Equals to /gc/heap/goal:bytes.
# TYPE go_memstats_next_gc_bytes gauge
go_memstats_next_gc_bytes 4.414354e+06
# HELP go_memstats_other_sys_bytes Number of bytes used for other system allocations. Equals to /memory/classes/other:bytes.
# TYPE go_memstats_other_sys_bytes gauge
go_memstats_other_sys_bytes 639838
# HELP go_memstats_stack_inuse_bytes Number of bytes obtained from system for stack allocator in non-CGO environments. Equals to /memory/classes/heap/stacks:bytes.
# TYPE go_memstats_stack_inuse_bytes gauge
go_memstats_stack_inuse_bytes 589824
# HELP go_memstats_stack_sys_bytes Number of bytes obtained from system for stack allocator. Equals to /memory/classes/heap/stacks:bytes + /memory/classes/os-stacks:bytes.
# TYPE go_memstats_stack_sys_bytes gauge
go_memstats_stack_sys_bytes 589824
# HELP go_memstats_sys_bytes Number of bytes obtained from system. Equals to /memory/classes/total:byte.
# TYPE go_memstats_sys_bytes gauge
go_memstats_sys_bytes 1.1754512e+07
# HELP go_sched_gomaxprocs_threads The current runtime.GOMAXPROCS setting, or the number of operating system threads that can execute user-level Go code simultaneously. Sourced from /sched/gomaxprocs:threads.
# TYPE go_sched_gomaxprocs_threads gauge
go_sched_gomaxprocs_threads 2
# HELP go_threads Number of OS threads created.
# TYPE go_threads gauge
go_threads 7
# HELP promhttp_metric_handler_requests_in_flight Current number of scrapes being served.
# TYPE promhttp_metric_handler_requests_in_flight gauge
promhttp_metric_handler_requests_in_flight 1
# HELP promhttp_metric_handler_requests_total Total number of scrapes by HTTP status code.
# TYPE promhttp_metric_handler_requests_total counter
promhttp_metric_handler_requests_total{code="200"} 1660
promhttp_metric_handler_requests_total{code="500"} 0
promhttp_metric_handler_requests_total{code="503"} 0
# HELP smtp_incoming_data Incoming Kbytes via SMTP: mailstats
# TYPE smtp_incoming_data gauge
smtp_incoming_data 215794
# HELP smtp_incoming_discarded_emails Discarded incoming emails via SMTP: mailstats
# TYPE smtp_incoming_discarded_emails gauge
smtp_incoming_discarded_emails 0
# HELP smtp_incoming_emails Incoming emails via SMTP: mailstats
# TYPE smtp_incoming_emails gauge
smtp_incoming_emails 8488
# HELP smtp_incoming_quarantined_emails Quarantined incoming emails via SMTP: mailstats
# TYPE smtp_incoming_quarantined_emails gauge
smtp_incoming_quarantined_emails 0
# HELP smtp_incoming_rejected_emails Rejected incoming emails via SMTP: mailstats
# TYPE smtp_incoming_rejected_emails gauge
smtp_incoming_rejected_emails 855
# HELP smtp_outcoming_data outcoming Kbytes via SMTP: mailstats
# TYPE smtp_outcoming_data gauge
smtp_outcoming_data 33737
# HELP smtp_outcoming_discarded_emails Discarded outcoming emails via SMTP: mailstats
# TYPE smtp_outcoming_discarded_emails gauge
smtp_outcoming_discarded_emails 0
# HELP smtp_outcoming_emails outcoming emails via SMTP: mailstats
# TYPE smtp_outcoming_emails gauge
smtp_outcoming_emails 74
# HELP smtp_outcoming_quarantined_emails Quarantined outcoming emails via SMTP: mailstats
# TYPE smtp_outcoming_quarantined_emails gauge
smtp_outcoming_quarantined_emails 0
# HELP smtp_outcoming_rejected_emails Rejected outcoming emails via SMTP: mailstats
# TYPE smtp_outcoming_rejected_emails gauge
smtp_outcoming_rejected_emails 6045
# HELP smtp_queued_emails_clientmqueue Queued emails: qmail -Ac
# TYPE smtp_queued_emails_clientmqueue gauge
smtp_queued_emails_clientmqueue 0
# HELP smtp_queued_emails_lost Queued emails: qmail -qL
# TYPE smtp_queued_emails_lost gauge
smtp_queued_emails_lost 0
# HELP smtp_queued_emails_mqueue Queued emails: qmail
# TYPE smtp_queued_emails_mqueue gauge
smtp_queued_emails_mqueue 0
# HELP smtp_queued_emails_quarantined Queued emails: qmail -qQ
# TYPE smtp_queued_emails_quarantined gauge
smtp_queued_emails_quarantined 0
Demonizamos el exporter:
#!/bin/sh
#
# PROVIDE: sendmailExporter
# REQUIRE: DAEMON
# KEYWORD: shutdown
. /etc/rc.subr
name="sendmailExporter"
rcvar="${name}_enable"
# Configuration
command="/usr/local/bin/sendmailExporter"
pidfile="/var/run/${name}.pid"
# Define commands
start_cmd="${name}_start"
stop_cmd="${name}_stop"
status_cmd="${name}_status"
sendmailExporter_start()
{
    if [ -f "${pidfile}" ] && kill -0 $(cat "${pidfile}") 2>/dev/null; then
        echo "${name} is already running."
    else
        echo "Starting ${name}..."
        # -f: daemonize and redirect output
        # -p: write child PID to file
        /usr/sbin/daemon -f -p ${pidfile} ${command}
    fi
}
sendmailExporter_stop()
{
    if [ -f "${pidfile}" ]; then
        echo "Stopping ${name}..."
        kill -s TERM $(cat "${pidfile}")
        # Wait for the process to exit
        sleep 2
        rm -f "${pidfile}"
        echo "Stopped."
    else
        echo "${name} is not running."
    fi
}
sendmailExporter_status()
{
    if [ -f "${pidfile}" ] && kill -0 $(cat "${pidfile}") 2>/dev/null; then
        echo "${name} is running with PID: $(cat ${pidfile})"
    else
        echo "${name} is not running."
        # Cleanup stale pidfile
        [ -f "${pidfile}" ] && rm -f "${pidfile}"
    fi
}
load_rc_config ${name}
run_rc_command "$1"
Asignamos los permisos necesarios a nuestro script RC:
Habilitamos el servicio:
Arrancamos el exporter:
Consultamos de nuevo las métricas para asegurarnos de que sigue funcionando:
Damos de alta el scrape en Prometheus:
  - job_name: 'sendmail_exporter'
    scrape_interval: 30s
    static_configs:
      - targets:
        - hellstorm:2525
        labels:
          scrape_interval: 30s
    basic_auth:
      username: sendmail_exporter_user
      password: PASSWORD
NOTA: Si cambiamos el intervalo de scrape es importante hacerlo también en la etiqueta scrape_interval de las gráficas de Grafana ya que se utiliza en las querys de las gráficas.
Reiniciamos el servicio:
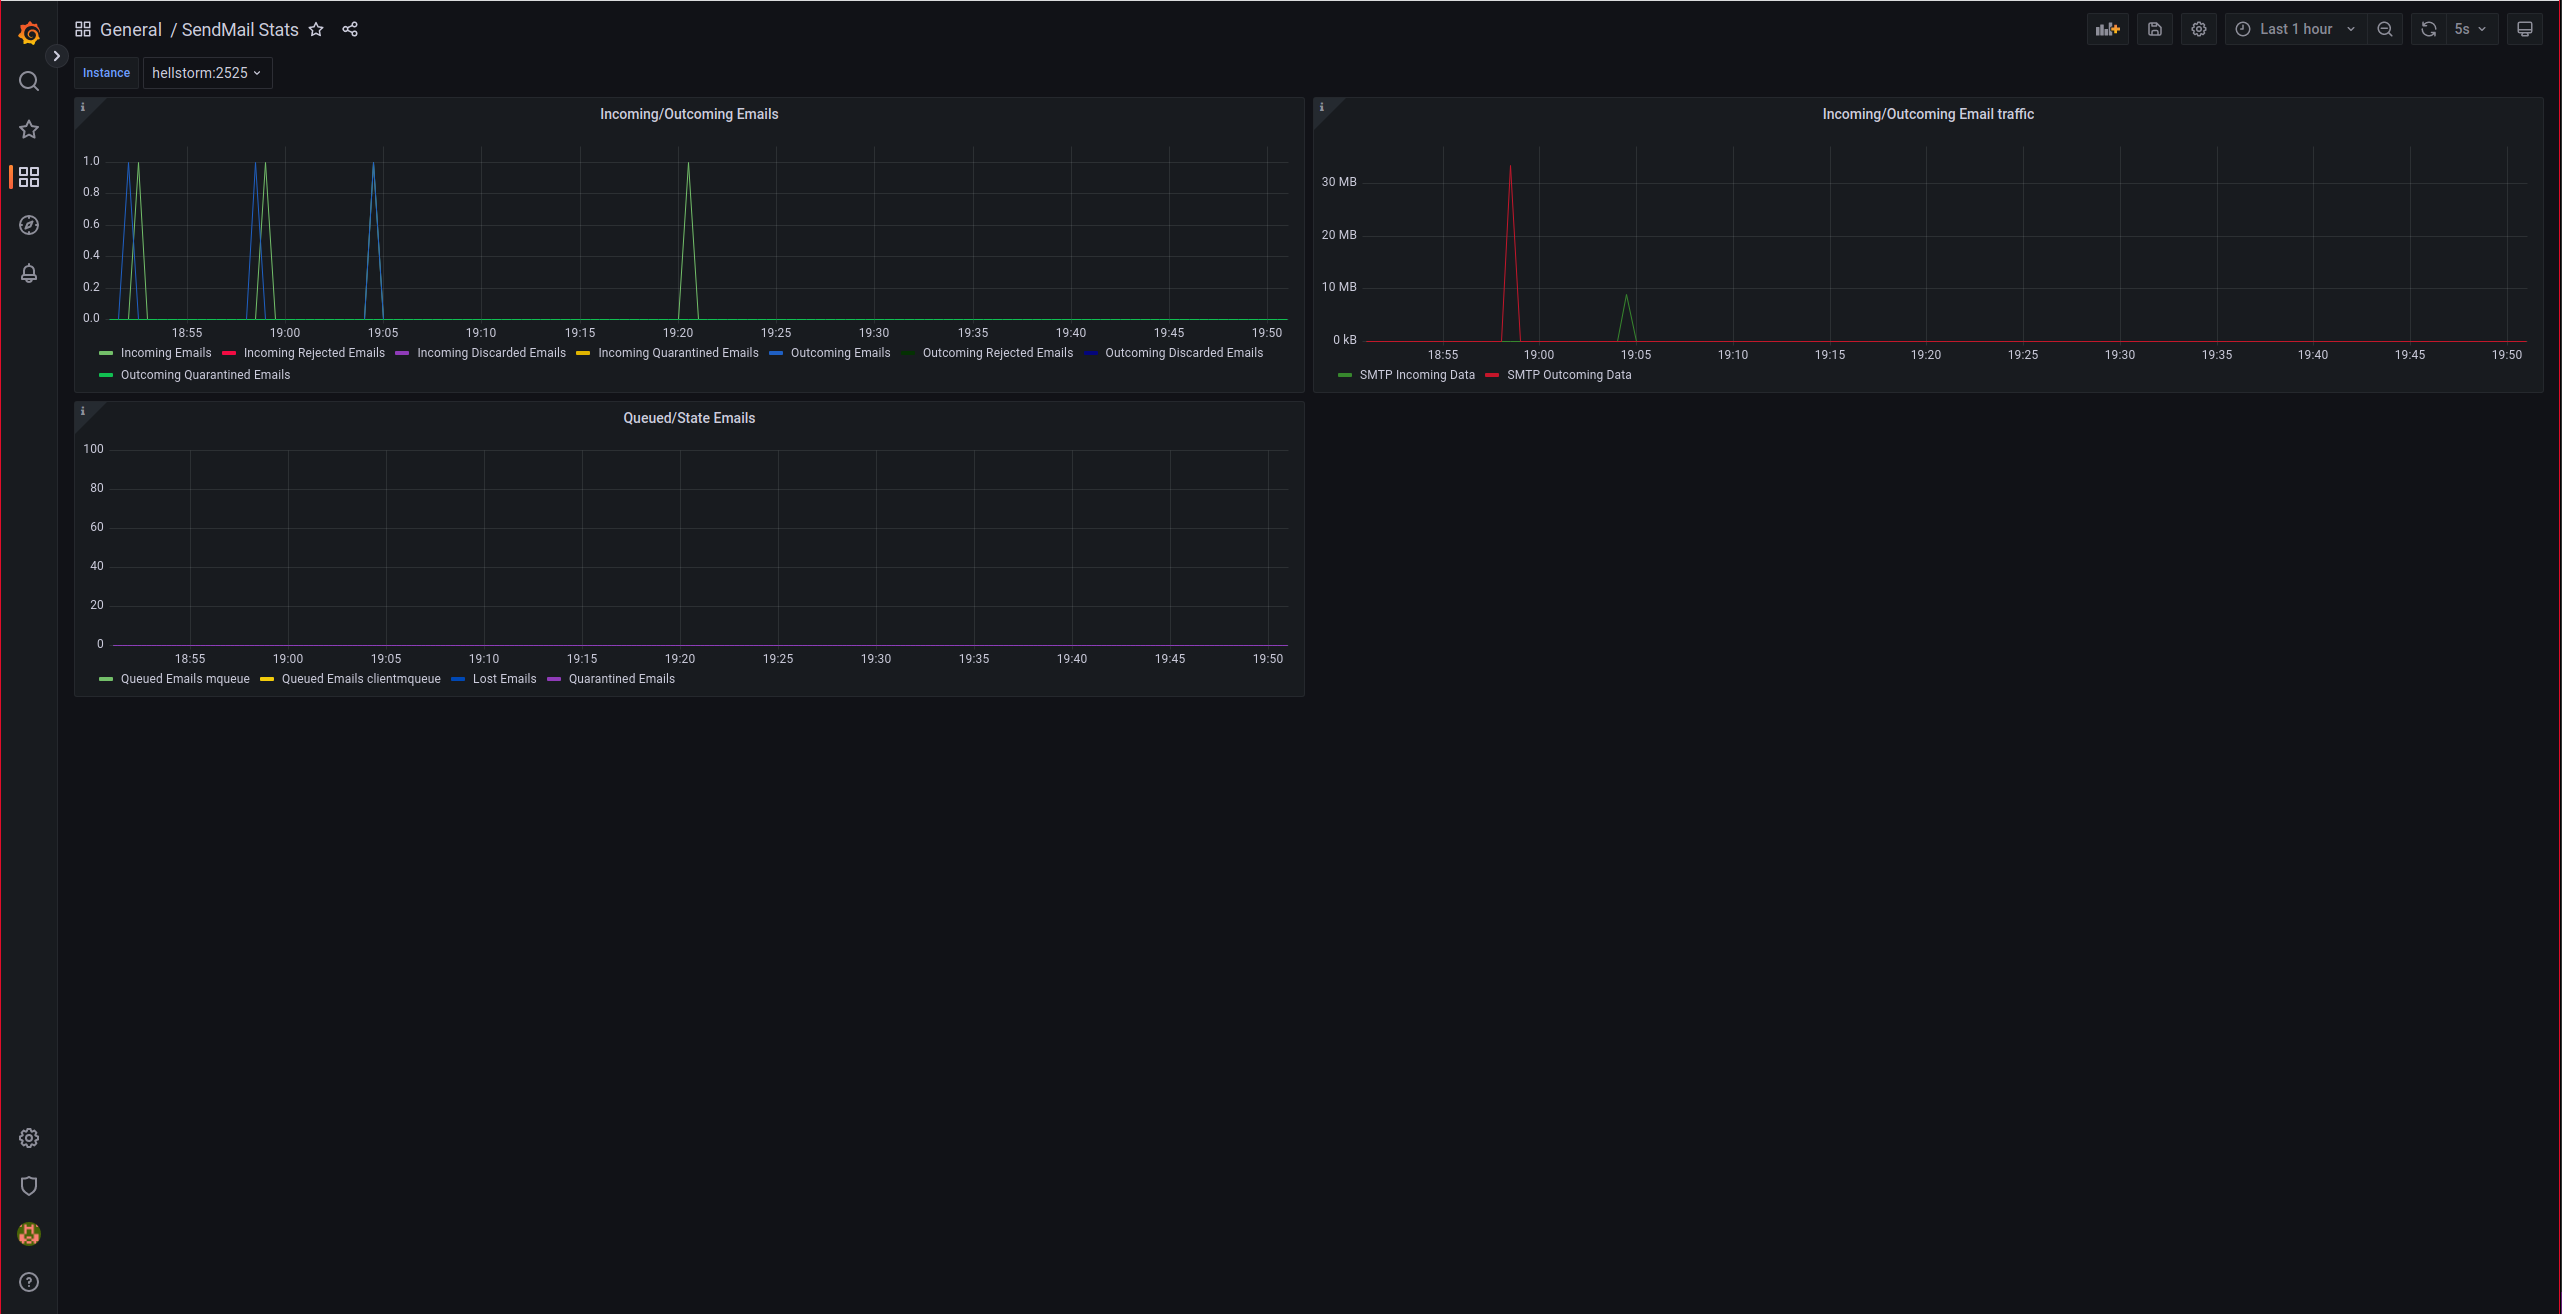
Importamos la siguiente dashboard en Grafana
Donde veremos las siguientes gráficas: