En este manual veremos como monitorizar un servidor Dovecot mediante Prometheus, si no hemos realizado la instalación base de Prometheus primero seguiremos la guía básica de instalación de Prometheus y Grafana.
Dovecot soporta de forma nativa Prometheus , tan solo debemos indicarle que métricas collectar y exponerlas. En el fichero de ejemplo hay algunas métricas predefinidas pero si necesitamos algo mas custom siempre podemos definir nuestros propios filtros en base a los eventos que nos interesen.
Copiamos el fichero de configuración de ejemplo:
Lo editamos descomentando las métricas que nos interesen y bindeando el exporter:
##
## Statistics and metrics
##

# Dovecot supports gathering statistics from events.
# Currently there are no statistics logged by default, and therefore they must
# be explicitly added using the metric configuration blocks.
#
# Unlike old stats, the new statistics do not require any plugins loaded.
#
# See https://doc.dovecot.org/configuration_manual/stats/ for more details.

##
## Example metrics
##

metric auth_success {
  filter = event=auth_request_finished AND success=yes
}

metric auth_failures {
  filter = event=auth_request_finished AND NOT success=yes
}

metric imap_command {
  filter = event=imap_command_finished
  group_by = cmd_name tagged_reply_state
}

metric smtp_command {
  filter = event=smtp_server_command_finished
  group_by = cmd_name status_code duration:exponential:1:5:10
}

metric mail_delivery {
  filter = event=mail_delivery_finished
  group_by = duration:exponential:1:5:10
}

##
## Prometheus
##

# To allow access to statistics with Prometheus, enable http listener
# on stats process. Stats will be available on /metrics path.
#
# See https://doc.dovecot.org/configuration_manual/stats/openmetrics/ for more
# details.

service stats {
  inet_listener http {
    port = 9900
  }
}

##
## Event exporting
##

# You can also export individual events.
#
# See https://doc.dovecot.org/configuration_manual/event_export/ for more
# details.

#event_exporter log {
#  format = json
#  format_args = time-rfc3339
#  transport = log
#}
#
#metric imap_commands {
#  exporter = log
#  filter = event=imap_command_finished
#}
Reiniciamos el servicio:
Comprobamos que las estadísticas estén disponibles:
metric_name                               field    count sum    min    max    avg       median stddev   %95
auth_success                              duration 10    86976  7594   13466  8697.60   7718   1845.96  13466
auth_failures                             duration 0     0      0      0      0.00      0      0.00     0
imap_command                              duration 40    348361 14     339435 8709.02   62     52959.89 793
imap_command_CAPABILITY                   duration 9     445    14     63     49.44     58     18.26    63
imap_command_CAPABILITY_OK                duration 9     445    14     63     49.44     58     18.26    63
imap_command_STATUS                       duration 15    4539   41     732    302.60    70     294.58   732
imap_command_STATUS_OK                    duration 15    4539   41     732    302.60    70     294.58   732
imap_command_LOGOUT                       duration 10    388    25     83     38.80     27     19.79    83
imap_command_LOGOUT_OK                    duration 10    388    25     83     38.80     27     19.79    83
imap_command_APPEND                       duration 1     339435 339435 339435 339435.00 339435 0.00     339435
imap_command_APPEND_OK                    duration 1     339435 339435 339435 339435.00 339435 0.00     339435
imap_command_LSUB                         duration 1     129    129    129    129.00    129    0.00     129
imap_command_LSUB_OK                      duration 1     129    129    129    129.00    129    0.00     129
imap_command_LIST                         duration 1     793    793    793    793.00    793    0.00     793
imap_command_LIST_OK                      duration 1     793    793    793    793.00    793    0.00     793
imap_command_NAMESPACE                    duration 1     18     18     18     18.00     18     0.00     18
imap_command_NAMESPACE_OK                 duration 1     18     18     18     18.00     18     0.00     18
imap_command_SELECT                       duration 1     2011   2011   2011   2011.00   2011   0.00     2011
imap_command_SELECT_OK                    duration 1     2011   2011   2011   2011.00   2011   0.00     2011
imap_command_UID_FETCH                    duration 1     603    603    603    603.00    603    0.00     603
imap_command_UID_FETCH_OK                 duration 1     603    603    603    603.00    603    0.00     603
smtp_command                              duration 5     6092   28     5441   1218.40   87     2117.61  5441
smtp_command_LHLO                         duration 1     87     87     87     87.00     87     0.00     87
smtp_command_LHLO_250                     duration 1     87     87     87     87.00     87     0.00     87
smtp_command_LHLO_250_duration_11_100     duration 1     87     87     87     87.00     87     0.00     87
smtp_command_MAIL                         duration 1     59     59     59     59.00     59     0.00     59
smtp_command_MAIL_250                     duration 1     59     59     59     59.00     59     0.00     59
smtp_command_MAIL_250_duration_11_100     duration 1     59     59     59     59.00     59     0.00     59
smtp_command_RCPT                         duration 1     477    477    477    477.00    477    0.00     477
smtp_command_RCPT_250                     duration 1     477    477    477    477.00    477    0.00     477
smtp_command_RCPT_250_duration_101_1000   duration 1     477    477    477    477.00    477    0.00     477
smtp_command_DATA                         duration 1     5441   5441   5441   5441.00   5441   0.00     5441
smtp_command_DATA_250                     duration 1     5441   5441   5441   5441.00   5441   0.00     5441
smtp_command_DATA_250_duration_1001_10000 duration 1     5441   5441   5441   5441.00   5441   0.00     5441
smtp_command_QUIT                         duration 1     28     28     28     28.00     28     0.00     28
smtp_command_QUIT_221                     duration 1     28     28     28     28.00     28     0.00     28
smtp_command_QUIT_221_duration_11_100     duration 1     28     28     28     28.00     28     0.00     28
mail_delivery                             duration 1     3941   3941   3941   3941.00   3941   0.00     3941
mail_delivery_duration_1001_10000         duration 1     3941   3941   3941   3941.00   3941   0.00     3941
Comprobamos manualmente desde el servidor prometheus que se pueda acceder a las métricas:
# HELP process_start_time_seconds Timestamp of service start
# TYPE process_start_time_seconds gauge
process_start_time_seconds 1672768567
# HELP dovecot_build Dovecot build information
# TYPE dovecot_build info
dovecot_build_info{version="2.3.19.1",revision="9b53102964"} 1
# HELP dovecot_auth_success Total number of all events of this kind
# TYPE dovecot_auth_success counter
dovecot_auth_success_total 13
# HELP dovecot_auth_success_duration_seconds Total duration of all events of this kind
# TYPE dovecot_auth_success_duration_seconds counter
dovecot_auth_success_duration_seconds_total 0.118286
# HELP dovecot_auth_failures Total number of all events of this kind
# TYPE dovecot_auth_failures counter
dovecot_auth_failures_total 0
# HELP dovecot_auth_failures_duration_seconds Total duration of all events of this kind
# TYPE dovecot_auth_failures_duration_seconds counter
dovecot_auth_failures_duration_seconds_total 0.000000
# HELP dovecot_imap_command Total number of all events of this kind
# TYPE dovecot_imap_command counter
dovecot_imap_command_total{cmd_name="CAPABILITY"} 12
dovecot_imap_command_total{cmd_name="CAPABILITY",tagged_reply_state="OK"} 12
dovecot_imap_command_total{cmd_name="STATUS"} 17
dovecot_imap_command_total{cmd_name="STATUS",tagged_reply_state="OK"} 17
dovecot_imap_command_total{cmd_name="LOGOUT"} 13
dovecot_imap_command_total{cmd_name="LOGOUT",tagged_reply_state="OK"} 13
dovecot_imap_command_total{cmd_name="APPEND"} 1
dovecot_imap_command_total{cmd_name="APPEND",tagged_reply_state="OK"} 1
dovecot_imap_command_total{cmd_name="LSUB"} 2
dovecot_imap_command_total{cmd_name="LSUB",tagged_reply_state="OK"} 2
dovecot_imap_command_total{cmd_name="LIST"} 2
dovecot_imap_command_total{cmd_name="LIST",tagged_reply_state="OK"} 2
dovecot_imap_command_total{cmd_name="NAMESPACE"} 2
dovecot_imap_command_total{cmd_name="NAMESPACE",tagged_reply_state="OK"} 2
dovecot_imap_command_total{cmd_name="SELECT"} 3
dovecot_imap_command_total{cmd_name="SELECT",tagged_reply_state="OK"} 3
dovecot_imap_command_total{cmd_name="UID FETCH"} 3
dovecot_imap_command_total{cmd_name="UID FETCH",tagged_reply_state="OK"} 3
dovecot_imap_command_total{cmd_name="UID SORT"} 1
dovecot_imap_command_total{cmd_name="UID SORT",tagged_reply_state="OK"} 1
dovecot_imap_command_count 56
# HELP dovecot_imap_command_duration_seconds Total duration of all events of this kind
# TYPE dovecot_imap_command_duration_seconds counter
dovecot_imap_command_duration_seconds_total{cmd_name="CAPABILITY"} 0.000574
dovecot_imap_command_duration_seconds_total{cmd_name="CAPABILITY",tagged_reply_state="OK"} 0.000574
dovecot_imap_command_duration_seconds_total{cmd_name="STATUS"} 0.005222
dovecot_imap_command_duration_seconds_total{cmd_name="STATUS",tagged_reply_state="OK"} 0.005222
dovecot_imap_command_duration_seconds_total{cmd_name="LOGOUT"} 0.001152
dovecot_imap_command_duration_seconds_total{cmd_name="LOGOUT",tagged_reply_state="OK"} 0.001152
dovecot_imap_command_duration_seconds_total{cmd_name="APPEND"} 0.339435
dovecot_imap_command_duration_seconds_total{cmd_name="APPEND",tagged_reply_state="OK"} 0.339435
dovecot_imap_command_duration_seconds_total{cmd_name="LSUB"} 0.000427
dovecot_imap_command_duration_seconds_total{cmd_name="LSUB",tagged_reply_state="OK"} 0.000427
dovecot_imap_command_duration_seconds_total{cmd_name="LIST"} 0.002619
dovecot_imap_command_duration_seconds_total{cmd_name="LIST",tagged_reply_state="OK"} 0.002619
dovecot_imap_command_duration_seconds_total{cmd_name="NAMESPACE"} 0.000064
dovecot_imap_command_duration_seconds_total{cmd_name="NAMESPACE",tagged_reply_state="OK"} 0.000064
dovecot_imap_command_duration_seconds_total{cmd_name="SELECT"} 0.004772
dovecot_imap_command_duration_seconds_total{cmd_name="SELECT",tagged_reply_state="OK"} 0.004772
dovecot_imap_command_duration_seconds_total{cmd_name="UID FETCH"} 0.001486
dovecot_imap_command_duration_seconds_total{cmd_name="UID FETCH",tagged_reply_state="OK"} 0.001486
dovecot_imap_command_duration_seconds_total{cmd_name="UID SORT"} 0.000311
dovecot_imap_command_duration_seconds_total{cmd_name="UID SORT",tagged_reply_state="OK"} 0.000311
dovecot_imap_command_duration_seconds_sum 0.356062
# HELP dovecot_smtp_command Histogram
# TYPE dovecot_smtp_command histogram
dovecot_smtp_command_bucket{cmd_name="LHLO",status_code="250",le="0.000010"} 0
dovecot_smtp_command_bucket{cmd_name="LHLO",status_code="250",le="0.000100"} 1
dovecot_smtp_command_bucket{cmd_name="LHLO",status_code="250",le="0.001000"} 1
dovecot_smtp_command_bucket{cmd_name="LHLO",status_code="250",le="0.010000"} 1
dovecot_smtp_command_bucket{cmd_name="LHLO",status_code="250",le="0.100000"} 1
dovecot_smtp_command_bucket{cmd_name="LHLO",status_code="250",le="+Inf"} 1
dovecot_smtp_command_sum{cmd_name="LHLO",status_code="250"} 0.000087
dovecot_smtp_command_count{cmd_name="LHLO",status_code="250"} 1
dovecot_smtp_command_bucket{cmd_name="MAIL",status_code="250",le="0.000010"} 0
dovecot_smtp_command_bucket{cmd_name="MAIL",status_code="250",le="0.000100"} 1
dovecot_smtp_command_bucket{cmd_name="MAIL",status_code="250",le="0.001000"} 1
dovecot_smtp_command_bucket{cmd_name="MAIL",status_code="250",le="0.010000"} 1
dovecot_smtp_command_bucket{cmd_name="MAIL",status_code="250",le="0.100000"} 1
dovecot_smtp_command_bucket{cmd_name="MAIL",status_code="250",le="+Inf"} 1
dovecot_smtp_command_sum{cmd_name="MAIL",status_code="250"} 0.000059
dovecot_smtp_command_count{cmd_name="MAIL",status_code="250"} 1
dovecot_smtp_command_bucket{cmd_name="RCPT",status_code="250",le="0.000010"} 0
dovecot_smtp_command_bucket{cmd_name="RCPT",status_code="250",le="0.000100"} 0
dovecot_smtp_command_bucket{cmd_name="RCPT",status_code="250",le="0.001000"} 1
dovecot_smtp_command_bucket{cmd_name="RCPT",status_code="250",le="0.010000"} 1
dovecot_smtp_command_bucket{cmd_name="RCPT",status_code="250",le="0.100000"} 1
dovecot_smtp_command_bucket{cmd_name="RCPT",status_code="250",le="+Inf"} 1
dovecot_smtp_command_sum{cmd_name="RCPT",status_code="250"} 0.000477
dovecot_smtp_command_count{cmd_name="RCPT",status_code="250"} 1
dovecot_smtp_command_bucket{cmd_name="DATA",status_code="250",le="0.000010"} 0
dovecot_smtp_command_bucket{cmd_name="DATA",status_code="250",le="0.000100"} 0
dovecot_smtp_command_bucket{cmd_name="DATA",status_code="250",le="0.001000"} 0
dovecot_smtp_command_bucket{cmd_name="DATA",status_code="250",le="0.010000"} 1
dovecot_smtp_command_bucket{cmd_name="DATA",status_code="250",le="0.100000"} 1
dovecot_smtp_command_bucket{cmd_name="DATA",status_code="250",le="+Inf"} 1
dovecot_smtp_command_sum{cmd_name="DATA",status_code="250"} 0.005441
dovecot_smtp_command_count{cmd_name="DATA",status_code="250"} 1
dovecot_smtp_command_bucket{cmd_name="QUIT",status_code="221",le="0.000010"} 0
dovecot_smtp_command_bucket{cmd_name="QUIT",status_code="221",le="0.000100"} 1
dovecot_smtp_command_bucket{cmd_name="QUIT",status_code="221",le="0.001000"} 1
dovecot_smtp_command_bucket{cmd_name="QUIT",status_code="221",le="0.010000"} 1
dovecot_smtp_command_bucket{cmd_name="QUIT",status_code="221",le="0.100000"} 1
dovecot_smtp_command_bucket{cmd_name="QUIT",status_code="221",le="+Inf"} 1
dovecot_smtp_command_sum{cmd_name="QUIT",status_code="221"} 0.000028
dovecot_smtp_command_count{cmd_name="QUIT",status_code="221"} 1
# HELP dovecot_mail_delivery Histogram
# TYPE dovecot_mail_delivery histogram
dovecot_mail_delivery_bucket{le="0.000010"} 0
dovecot_mail_delivery_bucket{le="0.000100"} 0
dovecot_mail_delivery_bucket{le="0.001000"} 0
dovecot_mail_delivery_bucket{le="0.010000"} 1
dovecot_mail_delivery_bucket{le="0.100000"} 1
dovecot_mail_delivery_bucket{le="+Inf"} 1
dovecot_mail_delivery_sum 0.003941
dovecot_mail_delivery_count 1
# EOF
Damos de alta un nuevo scrape:
  - job_name: 'dovecot_exporter'
    scrape_interval: 30s
    static_configs:
      - targets:
        - hellstorm:9900
        labels:
          scrape_interval: 30s
Reiniciamos el servicio:
NOTA: Si cambiamos el intervalo de scrape es importante hacerlo también en la etiqueta scrape_interval de las gráficas de Grafana ya que se utiliza en las querys de las gráficas.
Debemos tener en cuenta que este exporter NO pide autenticación por lo tanto debemos restringir el acceso mediante firewall o bindear el exporter a localhost e instalar algún servidor web como Nginx para que pida credenciales y actúe como intermediario. En caso de tratarse de una jail en modo bridge no tendremos interfaz de loopback, por lo tanto debemos bindear las stats a otro puerto, bindear Nginx en el 9900 y restringir por firewall el acceso al puerto de las stats para que solo se pueda acceder desde la ip local. En el scrape deberíamos definir las credenciales.
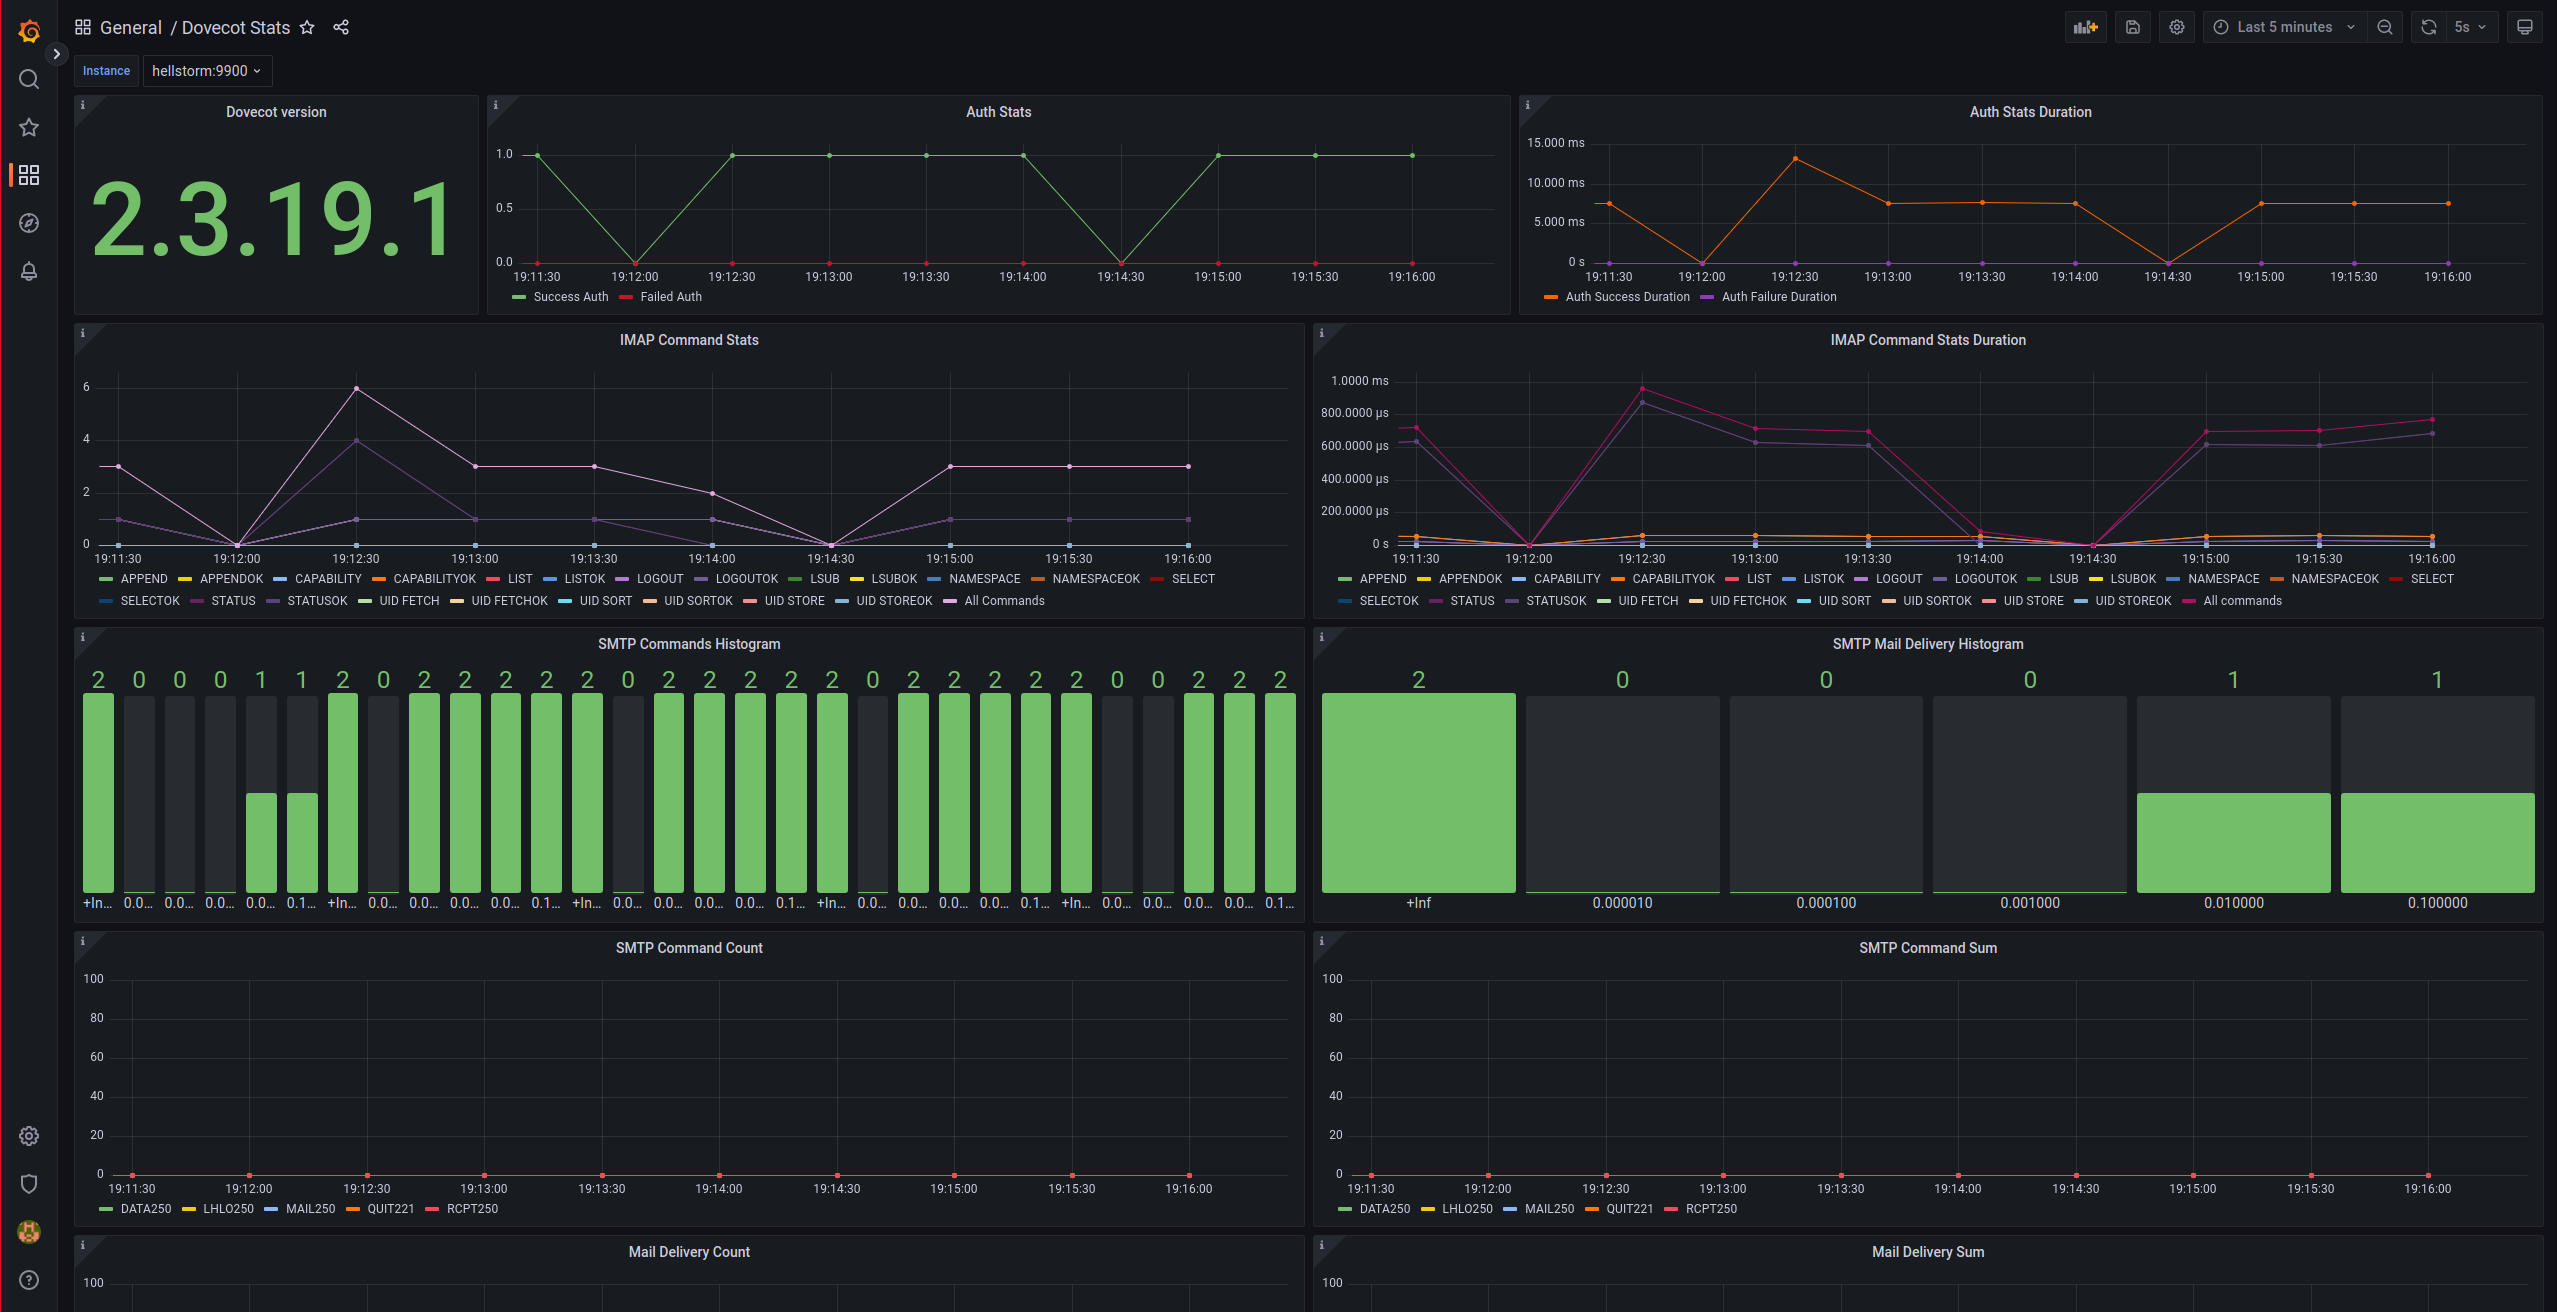
Cargamos en Grafana la
siguiente dashboard