As we know, Prometheus allows monitoring a wide range of services. This monitoring is carried out through certain exporters that collect the metrics consumed by Prometheus. In this article, I will explain how to set up two Redis servers in master/slave mode and how to monitor them using PMM2.
We compile and install Redis:
We enable the service at startup:
/etc/init.d/redis start
In the master, we bind the service to all IPs and assign an access password:
bind 0.0.0.0
requirepass PASSWORD
We apply the configuration by restarting the service:
In the slave, we perform the same configuration as in the master, but we also indicate who its master is and with what password to connect to it:
bind 0.0.0.0
requirepass PASSWORD
slaveof MASTER_IP 6379
masterauth PASSWORD
We apply the configuration by restarting the service:
We check that the slave is synchronized with the master:
# Replication
role:slave
master_host:MASTER_IP
master_port:6379
master_link_status:up
In the list of exporters on the Prometheus website, we can find the Redis exporter .
We compile and install the dependencies to compile the exporter:
We download the exporter and compile it:
export GOPATH=/root/go
export GOPATH=$(go env GOPATH)
go get github.com/oliver006/redis_exporter
cd /root/go/bin/
export REDIS_PASSWORD=PASSWORD
We manually start the exporter to check that there are no issues:
We create a startup script:
nohup /root/go/bin/redis_exporter --redis.password=PASSWORD --web.listen-address=127.0.0.1:9121 &
We assign the necessary permissions and start the service:
/etc/local.d/redis_exporter.start
We check that it has been bound to the correct IP address:
tcp 0 0 127.0.0.1:9121 0.0.0.0:* LISTEN 5526/redis_exporter
We check that we can obtain the metrics locally:
To protect access to the exporter with a password, we will use Nginx authentication:
We configure Nginx to request a password if the request does not come from the PMM server:
...
server {
  listen SERVER_IP:9121;
  server_name _;

  location / {
      satisfy any;
      allow  PMM_SERVER_IP/32;
      auth_basic "Restricted Content";
      auth_basic_user_file /etc/nginx/.htpasswd;
      deny all;

      proxy_pass http://127.0.0.1:9121;
  }
}
...
We generate the password file:
htpasswd -c /etc/nginx/.htpasswd admin
We restart Nginx:
We check that it does not request a password from the PMM server:
From any other location, it should request a password:
Telegrambot and the PMM API need the node_name tag to correctly identify the server and display alarms with the correct information:
scrape_configs:
- job_name: redis_exporter
  static_configs:
  - targets:
    - SERVER1:9121
    - SERVER2:9121
  relabel_configs:
  - source_labels: [__address__]
    target_label: node_name
NOTE: We can find the source_label by going to Status -> Targets and hovering over the labels.

Reload the PMM configuration:
The Prometheus alerts would be these, remember that in PMM2 the alerts are configured from Grafana ( http://pmm.alfaexploit.com/graph/d/pmm-settings/) :
- name: redisRules
  rules:
  - alert: RedisDown
    expr: redis_up == 0
    for: 5m
    labels:
      severity: critical
  - alert: RedisMem
    expr: redis_memory_used_bytes > (60 * node_memory_MemTotal) / 100
    for: 5m
    labels:
      severity: critical
  - alert: RedisRejectingConnections
    expr: delta(redis_rejected_connections_total[1m]) > 5
    for: 5m
    labels:
      severity: critical
  - alert: BrokenRedisSlave
    expr: redis_master_last_io_seconds == -1
    for: 5m
    labels:
      severity: critical
  - alert: BrokenRedisSlave
    expr: redis_master_last_io_seconds_ago == -1
    for: 5m
    labels:
      severity: critical
Reload the PMM configuration:
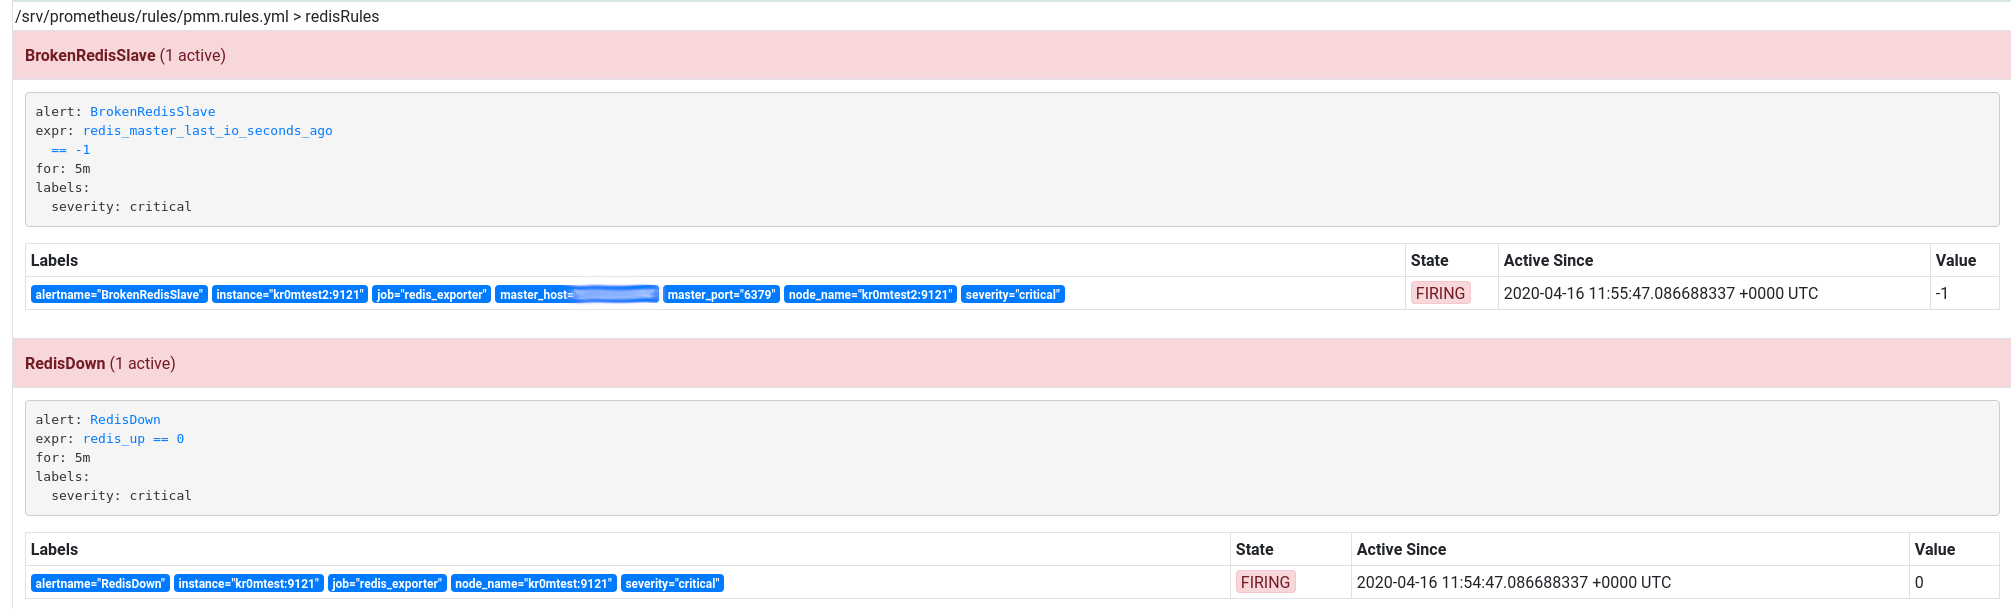
If we stop a master, for example, the RedisDown alarms for the master and BrokenRedisSlave for the slave will be triggered:
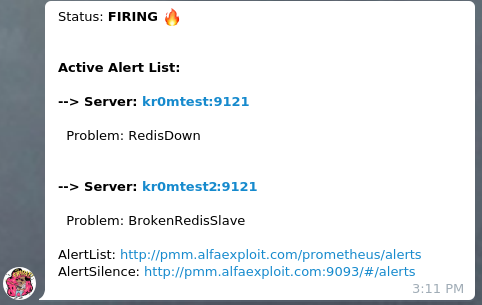
If we have followed the guide on
Alertmanager
, we will see alerts like this in Telegram:
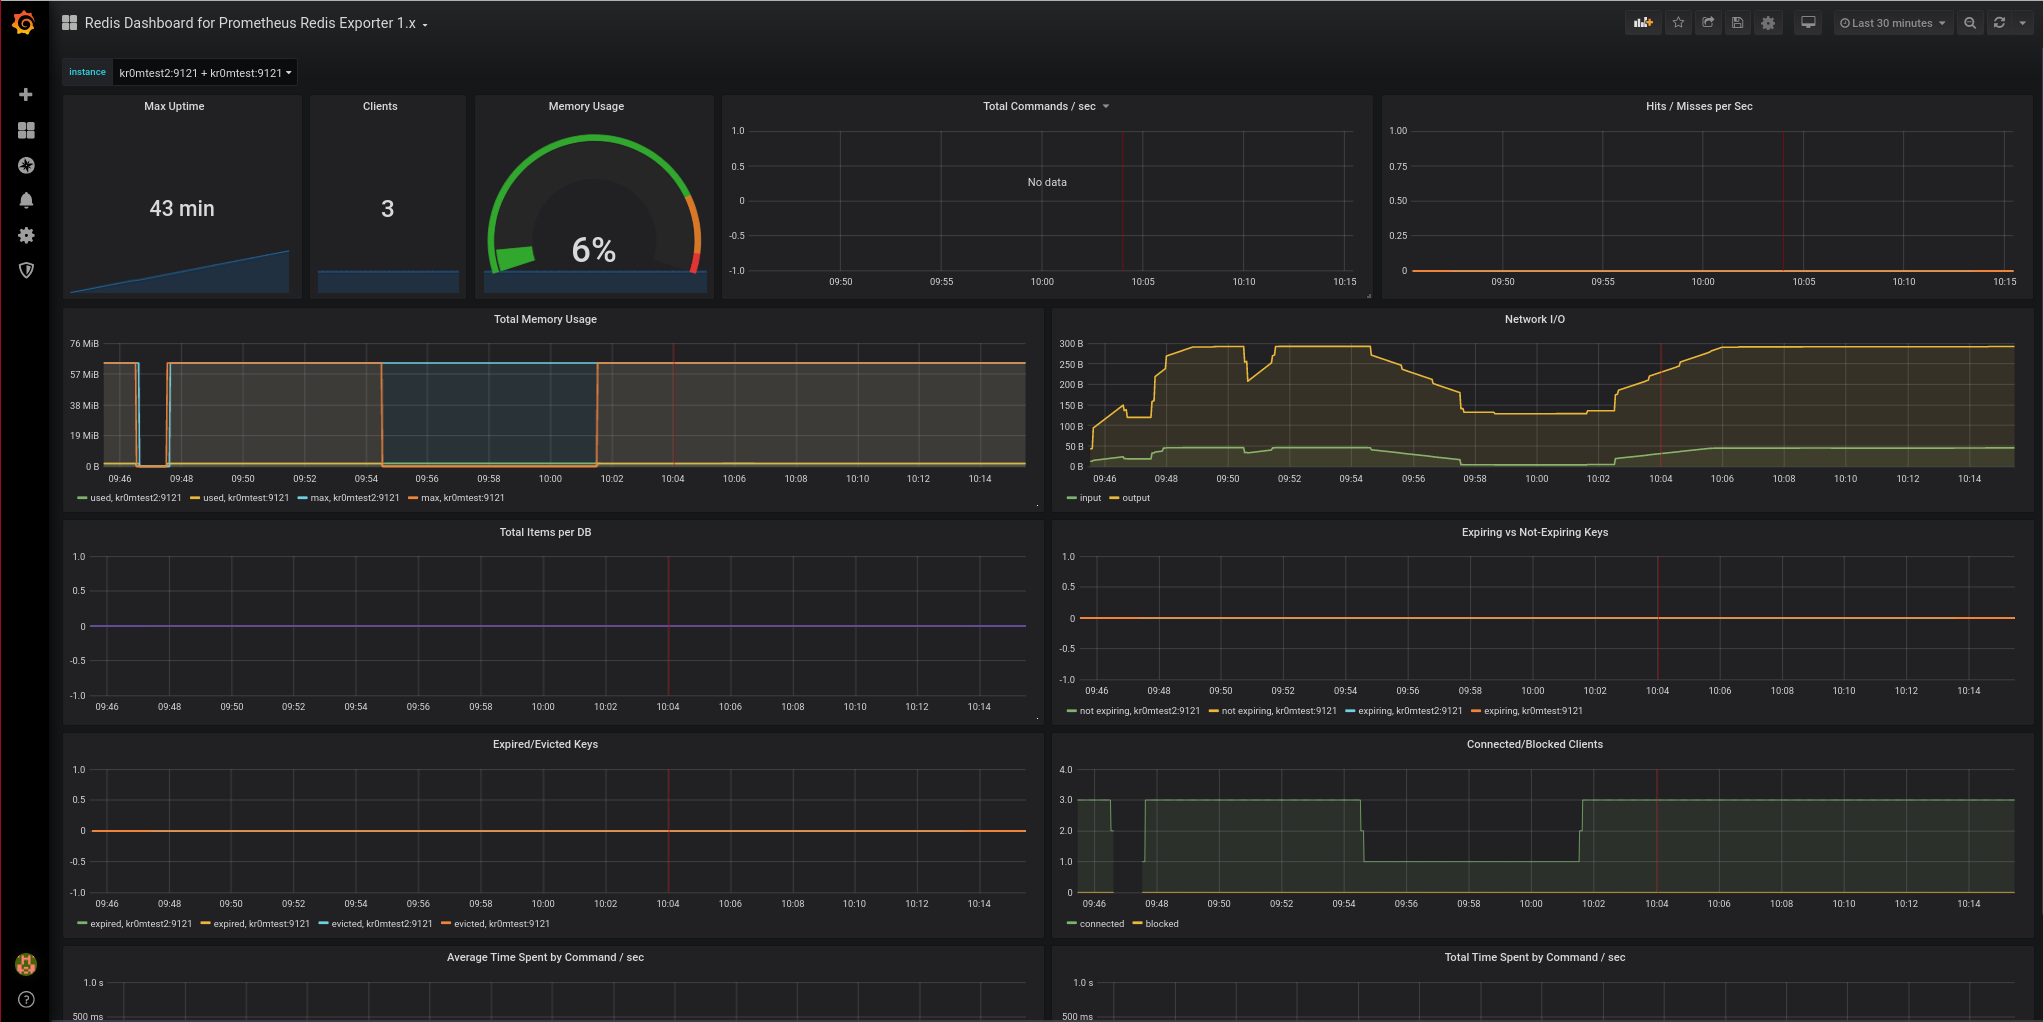
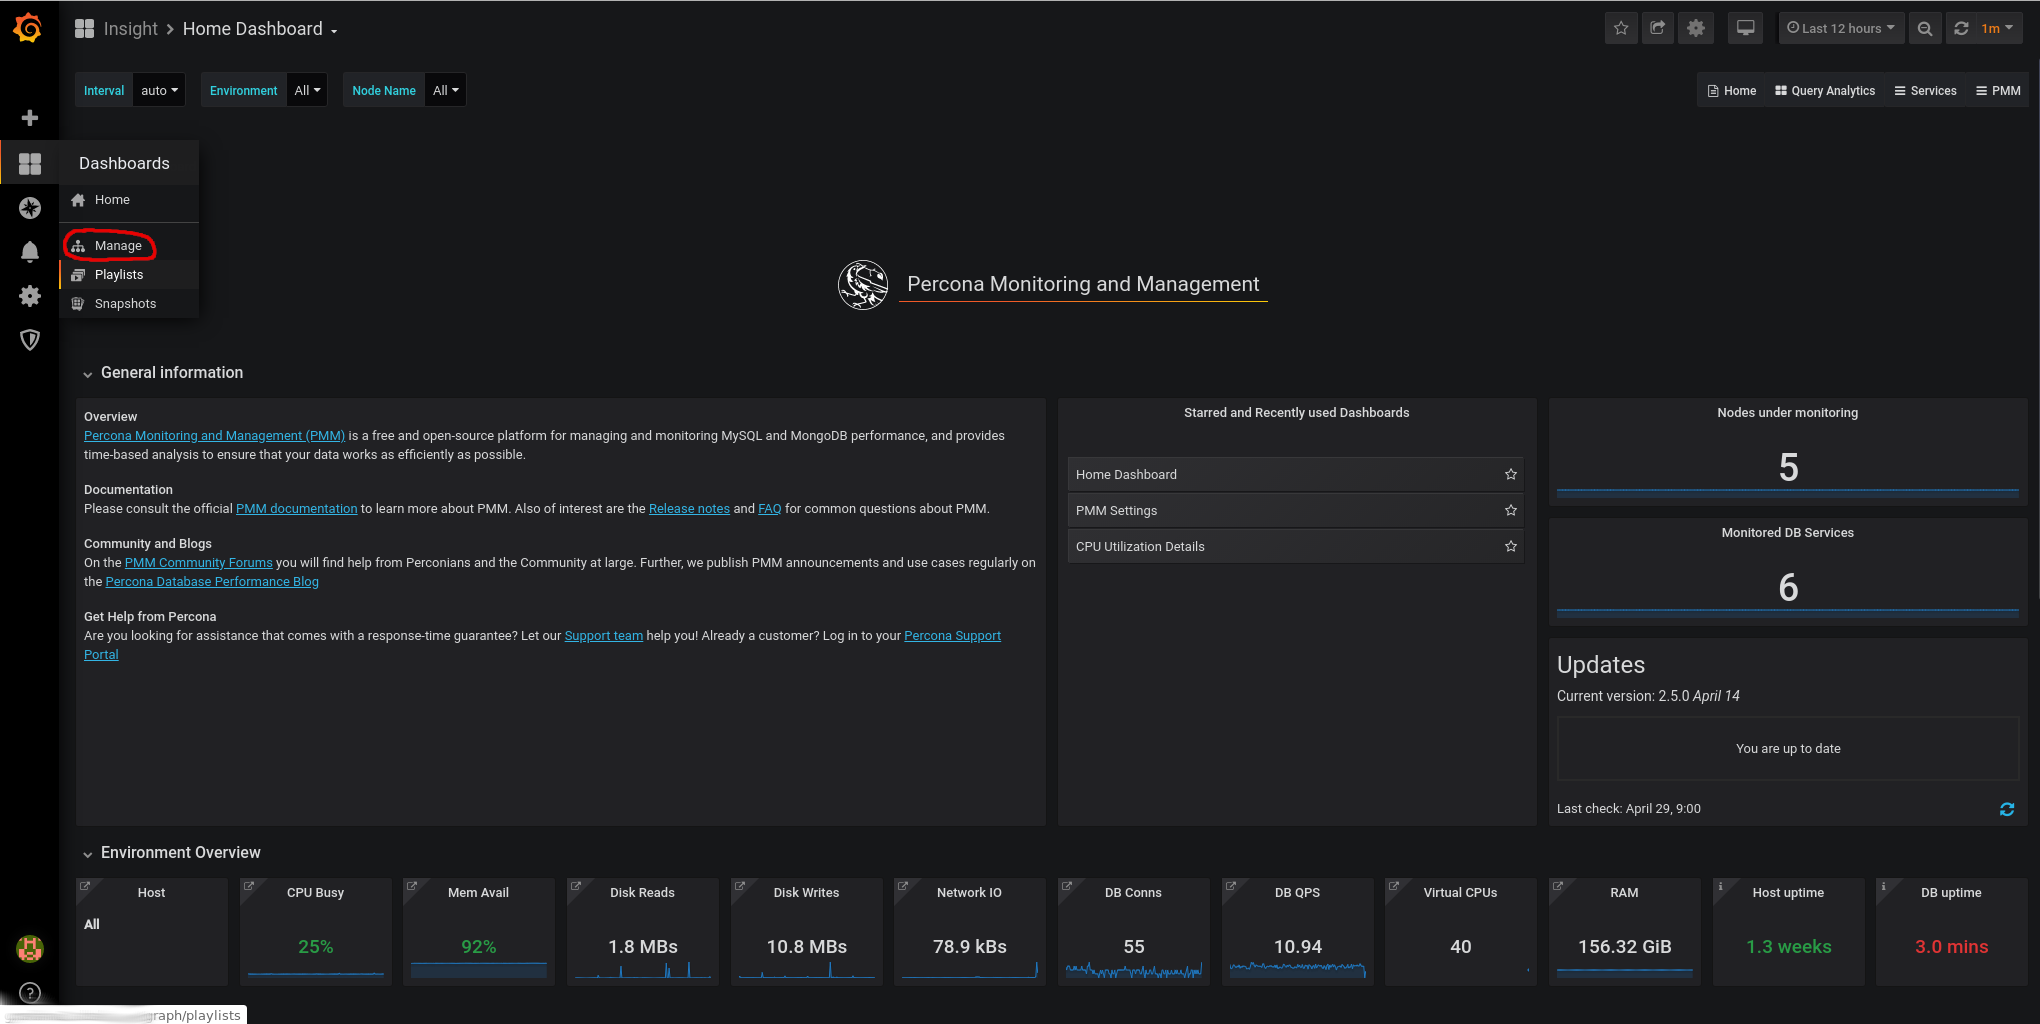
We import the redis template in Grafana to see the metrics charts:
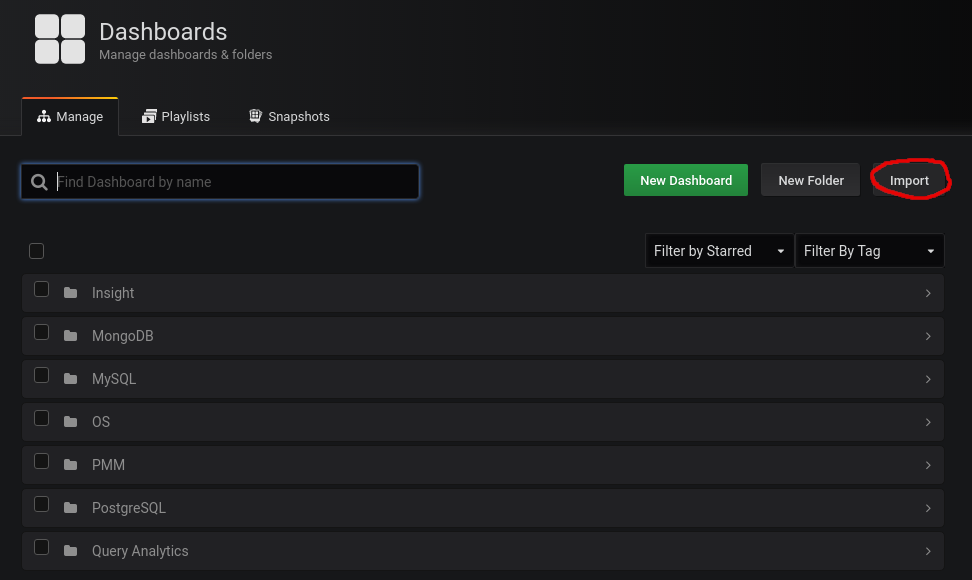
We paste the
json of the template
:
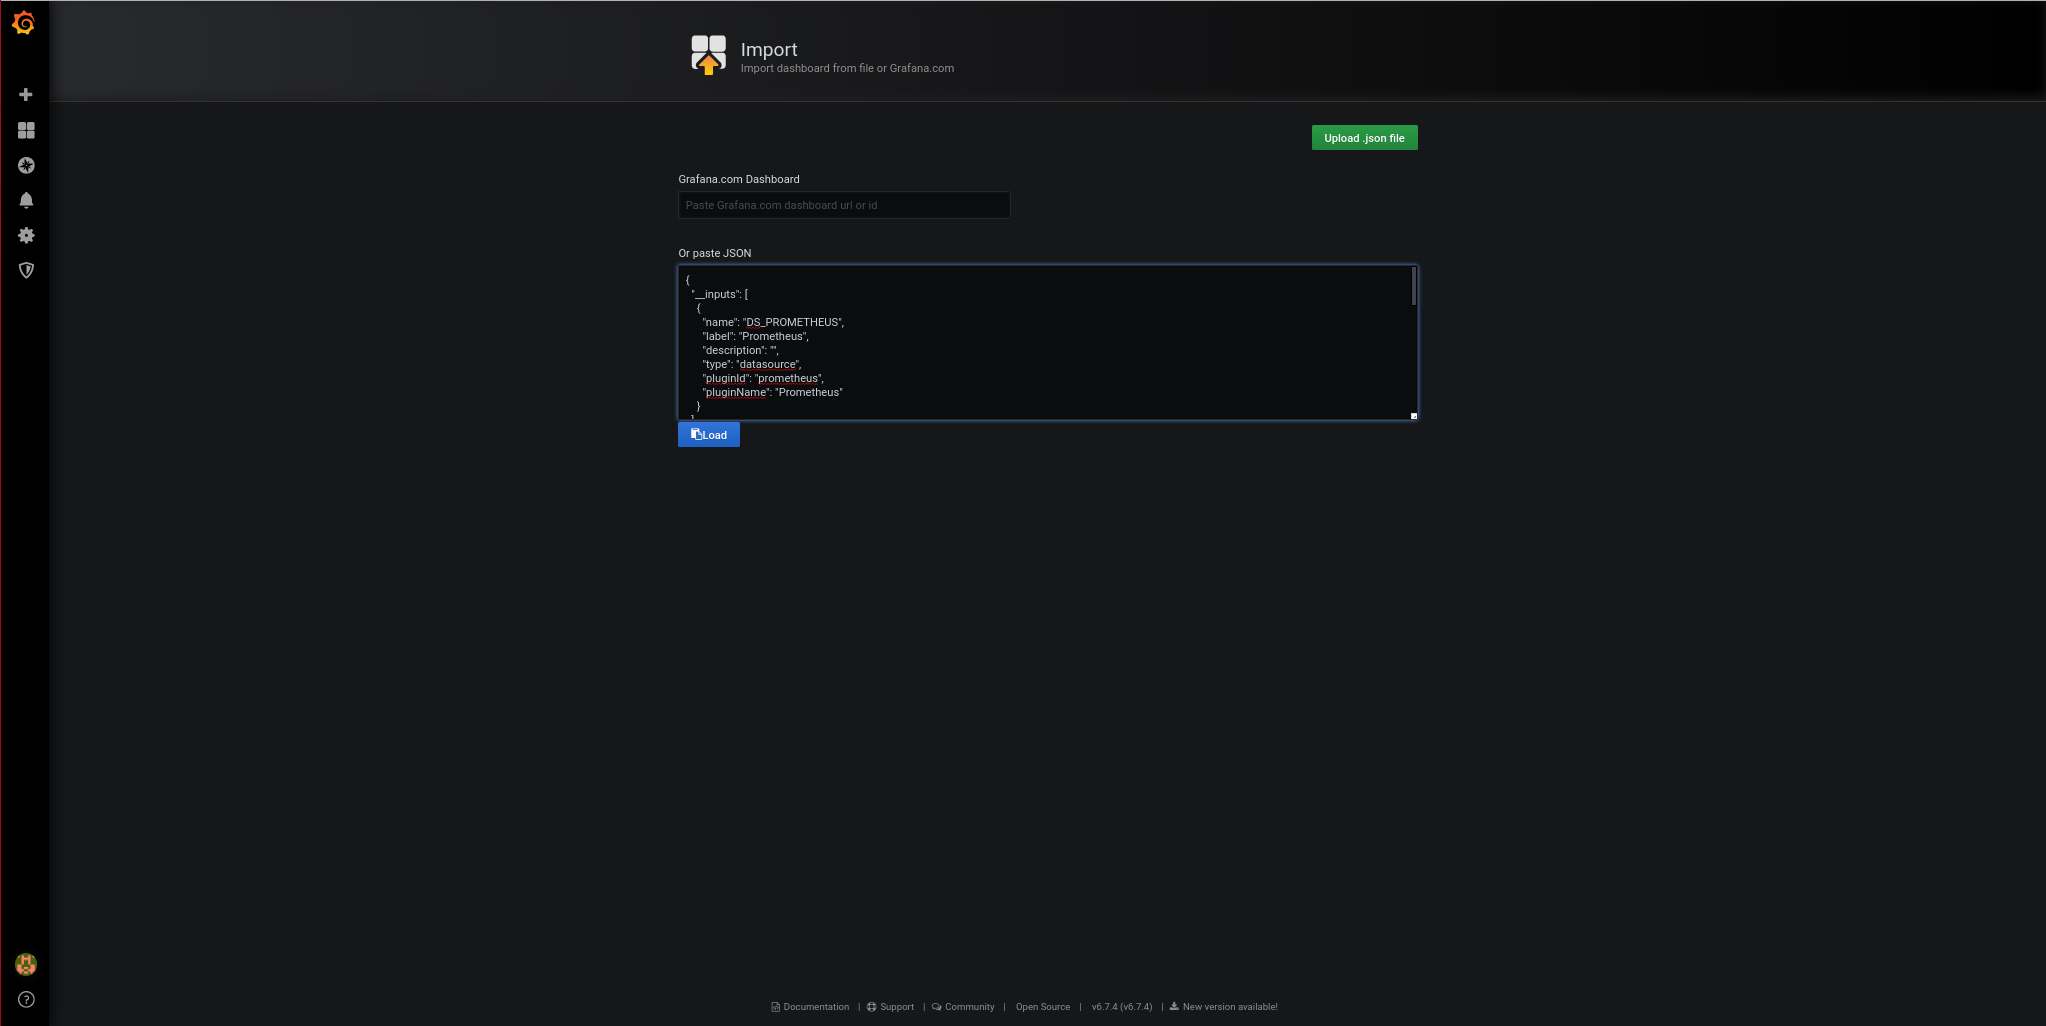
We click on Load.
We assign a name to the dashboard:
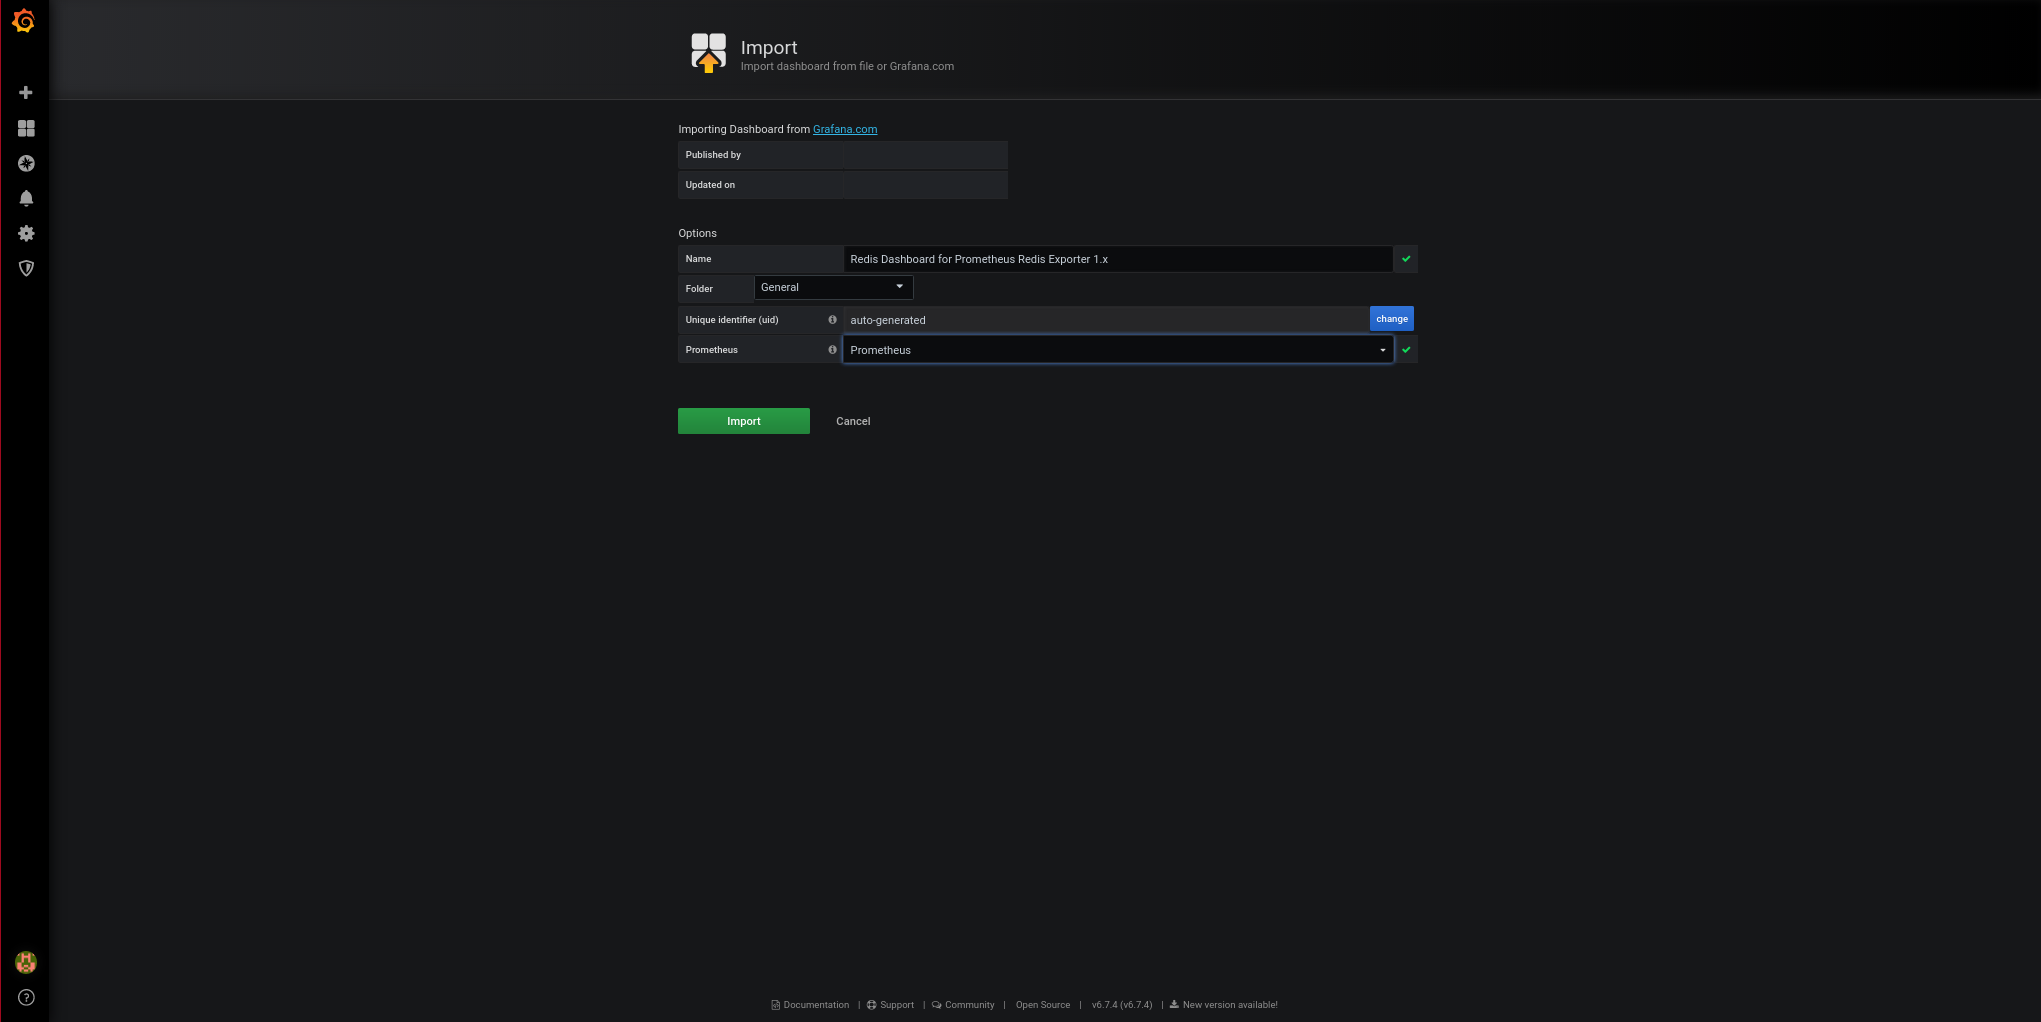
We click on Import.
The final result is this: