Continuing with the installation of php-fpm from the previous article, we will configure php-fpm-exporter. This way, we can monitor FPM, configure alerts, and visualize graphs of the data obtained through Grafana.
On the
Prometheus
website, we find the exporter from
bakins
, which is hosted on GitHub. Therefore, we compile and install git to download the code:
It is programmed in Go, so we compile and install Go:
We clone the repository and compile the binary:
We check that it has compiled correctly:
usage: php-fpm-exporter.linux.amd64 [<flags>]

Flags:
  -h, --help                   Show context-sensitive help (also try --help-long and --help-man).
      --addr="127.0.0.1:8080"  listen address for metrics handler
      --endpoint="http://127.0.0.1:9000/status"
                               url for php-fpm status
      --fastcgi=FASTCGI        fastcgi url. If this is set, fastcgi will be used instead of HTTP
      --web.telemetry-path="/metrics"
                               Path under which to expose metrics. Cannot be /
We compile and install php with support for FPM:
echo “dev-lang/php acl berkdb bzip2 cli ctype fileinfo filter flatfile gdbm iconv ipv6 json nls opcache phar posix readline session simplexml ssl tokenizer unicode xml zlib -apache2 -argon2 -bcmath -calendar -cdb -cgi -cjk -coverage -curl -debug -embed -enchant -exif -ffi -firebird fpm -ftp -gd -gmp -imap -inifile -intl -iodbc -kerberos -ldap -ldap-sasl -libedit -libressl -lmdb -mhash -mssql -mysql -mysqli -oci8-instant-client -odbc -pcntl -pdo -phpdbg -postgres -qdbm -selinux -session-mm -sharedmem -snmp -soap -sockets -sodium -spell -sqlite -systemd -sysvipc -test -threads -tidy -tokyocabinet -truetype -webp -xmlreader -xmlrpc -xmlwriter -xpm -xslt -zip” > /etc/portage/package.use/php
echo “app-eselect/eselect-php fpm” » /etc/portage/package.use/php
emerge -av dev-lang/php
Enable FPM status:
[www]
user = nobody
group = nobody
listen = /run/php-fpm.socket
pm = dynamic
pm.max_children = 5
pm.start_servers = 2
pm.min_spare_servers = 1
pm.max_spare_servers = 3
pm.status_path = /status
ping.path = /ping
ping.response = pong
Restart the service:
The exporter can query the FPM status through a web server that redirects us to FPM or directly to FPM:
--endpoint string   url for php-fpm status (default "http://127.0.0.1:9000/status")
--fastcgi string    fastcgi url. If this is set, fastcgi will be used instead of HTTP
The easiest way is for the exporter to access FPM directly, bind it to the loopback, and configure Nginx or the server we are going to use to request access credentials:
NOTE: Another option would be to insert firewall rules to allow only the PMM IP, but then we could no longer directly query the metrics from our browser, at least not without some kind of tunnel like a SOCKS proxy.
Daemonize the service:
nohup /root/php-fpm-exporter/php-fpm-exporter.linux.amd64 --addr 127.0.0.1:8080 --fastcgi unix:///run/php-fpm.socket &
Assign the necessary permissions:
Start it:
Check that it has started and is listening:
tcp 0 0 127.0.0.1:8080 0.0.0.0:* LISTEN 841/php-fpm-exporte
Check that the metrics appear by querying them locally:
phpfpm_accepted_connections_total 6
phpfpm_active_max_processes 1
phpfpm_listen_queue_connections 0
phpfpm_listen_queue_length_connections 0
phpfpm_listen_queue_max_connections 0
phpfpm_max_children_reached_total 0
phpfpm_processes_total{state="active"} 1
phpfpm_processes_total{state="idle"} 1
phpfpm_scrape_failures_total 0
phpfpm_slow_requests_total 0
phpfpm_up 1
Compile and install the web server, in my case Nginx:
Now we will configure Nginx to serve metrics to the outside but requiring prior authentication. We will whitelist the PMM IP so that it does not require a password from that IP address:
...
server {
    listen SERVER_IP:8080;
    server_name _;

    location / {
        satisfy any;
        allow  PMM_SERVER_IP/32;
        auth_basic "Restricted Content";
        auth_basic_user_file /etc/nginx/.htpasswd;
        deny   all;

        proxy_pass http://localhost:8080;
    }
}
...
Restart the service to apply the configuration:
Generate the password file:
htpasswd -c /etc/nginx/.htpasswd admin
The Prometheus configuration would be as follows:
scrape_configs:
- job_name: fpm-status
  scrape_interval: 1m
  scrape_timeout: 10s
  metrics_path: /metrics
  scheme: http
  static_configs:
  - targets:
    - SERVER:8080
Apply the new configuration by restarting PMM:
Access from the outside with the credentials:
In Prometheus, we can now see the target:

The Prometheus alerts would be as follows. Remember that in PMM, alerts are configured from Grafana ( http://pmm.alfaexploit.com/graph/d/pmm-settings/) :
- name: fpmRules
rules:
- alert: fpmExporterDown
expr: up{job="fpm-status"} == 0
for: 5m
labels:
severity: critical
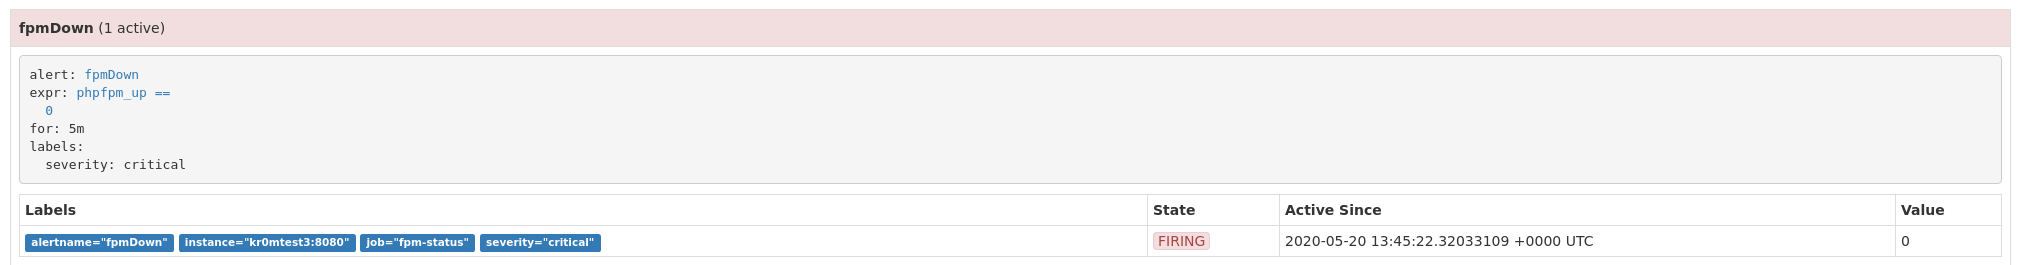
- alert: fpmDown
expr: phpfpm_up == 0
for: 5m
labels:
severity: critical
- alert: fpmMaxChildrenReached
expr: phpfpm_max_children_reached_total{job="fpm-status"} == 1
for: 5m
labels:
severity: critical
If we stop the FPM on the server, we will see the following alarm:
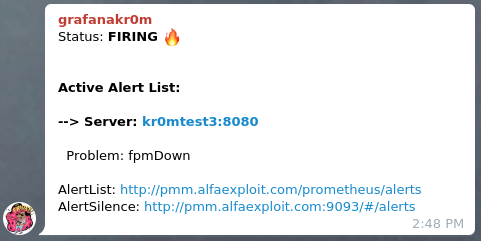
If we have followed the guide on
Alertmanager
, we will see alerts in Telegram like this:
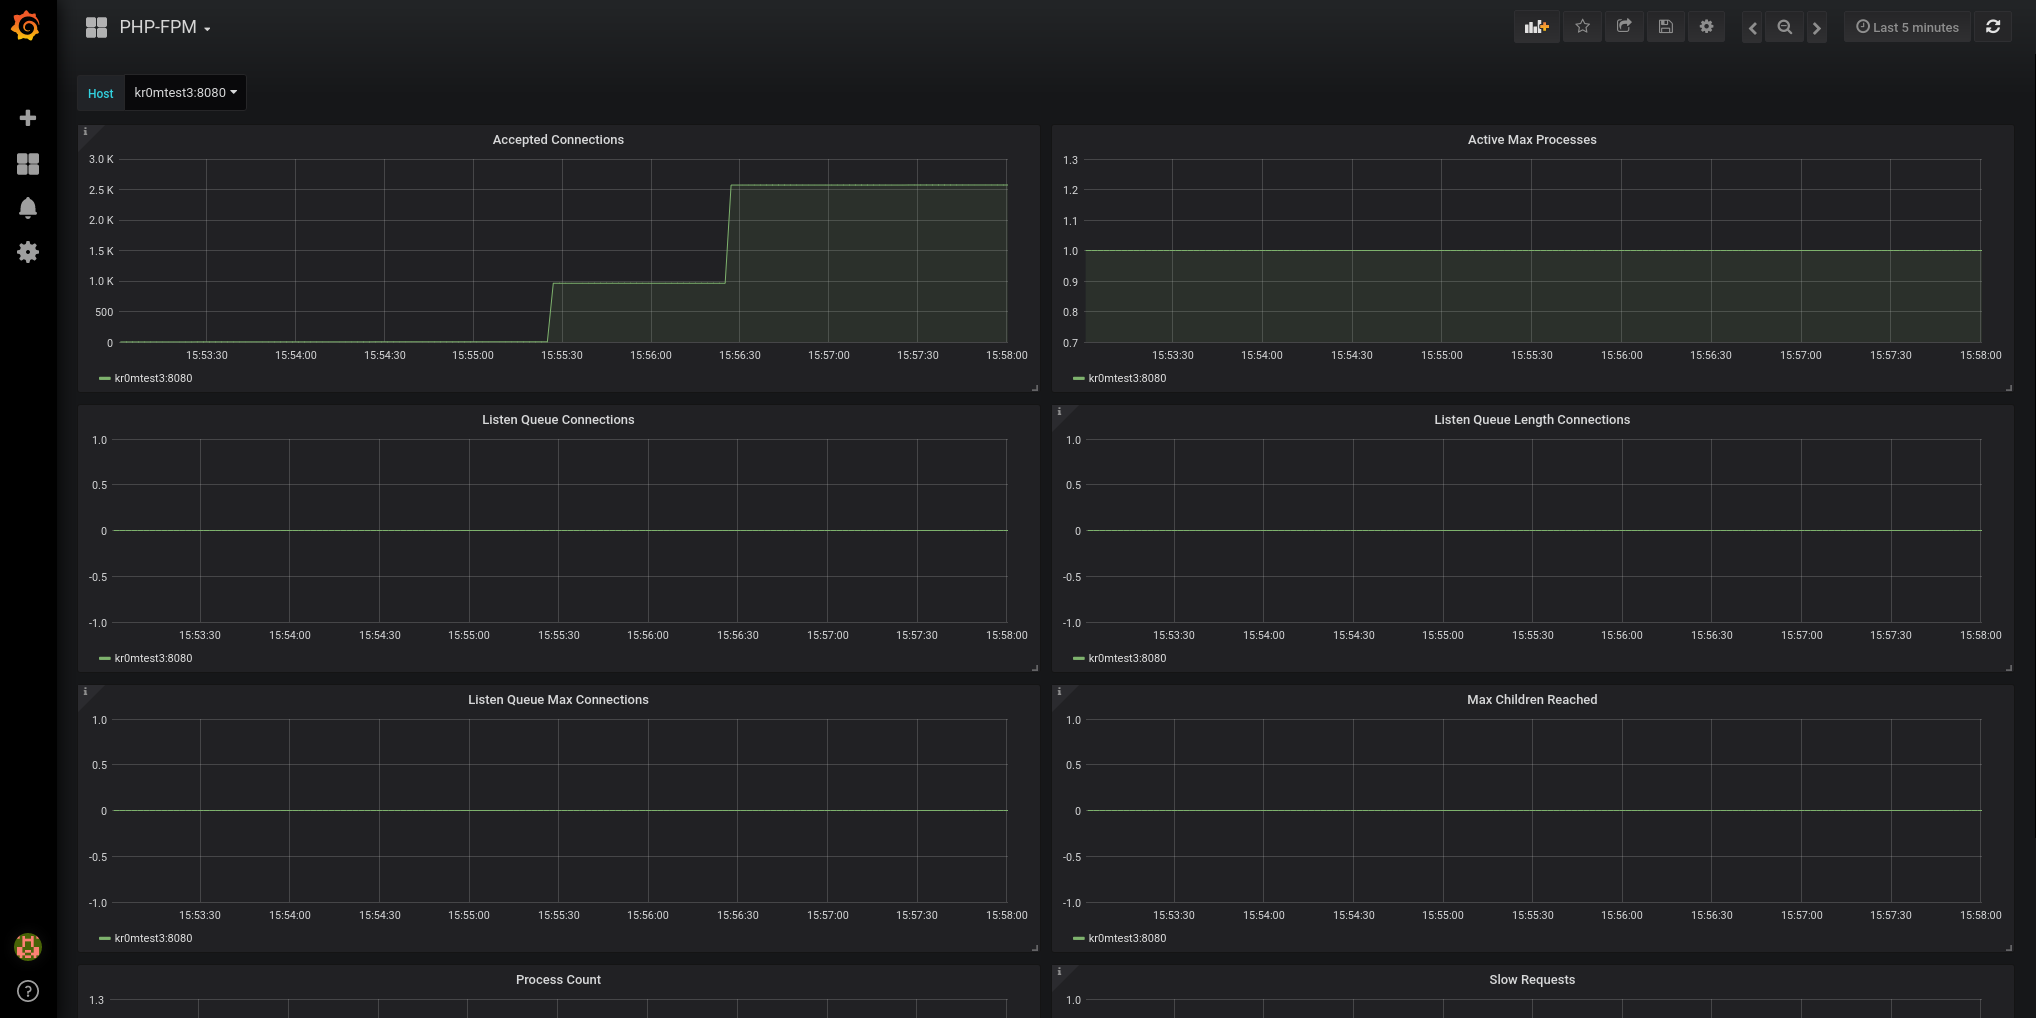
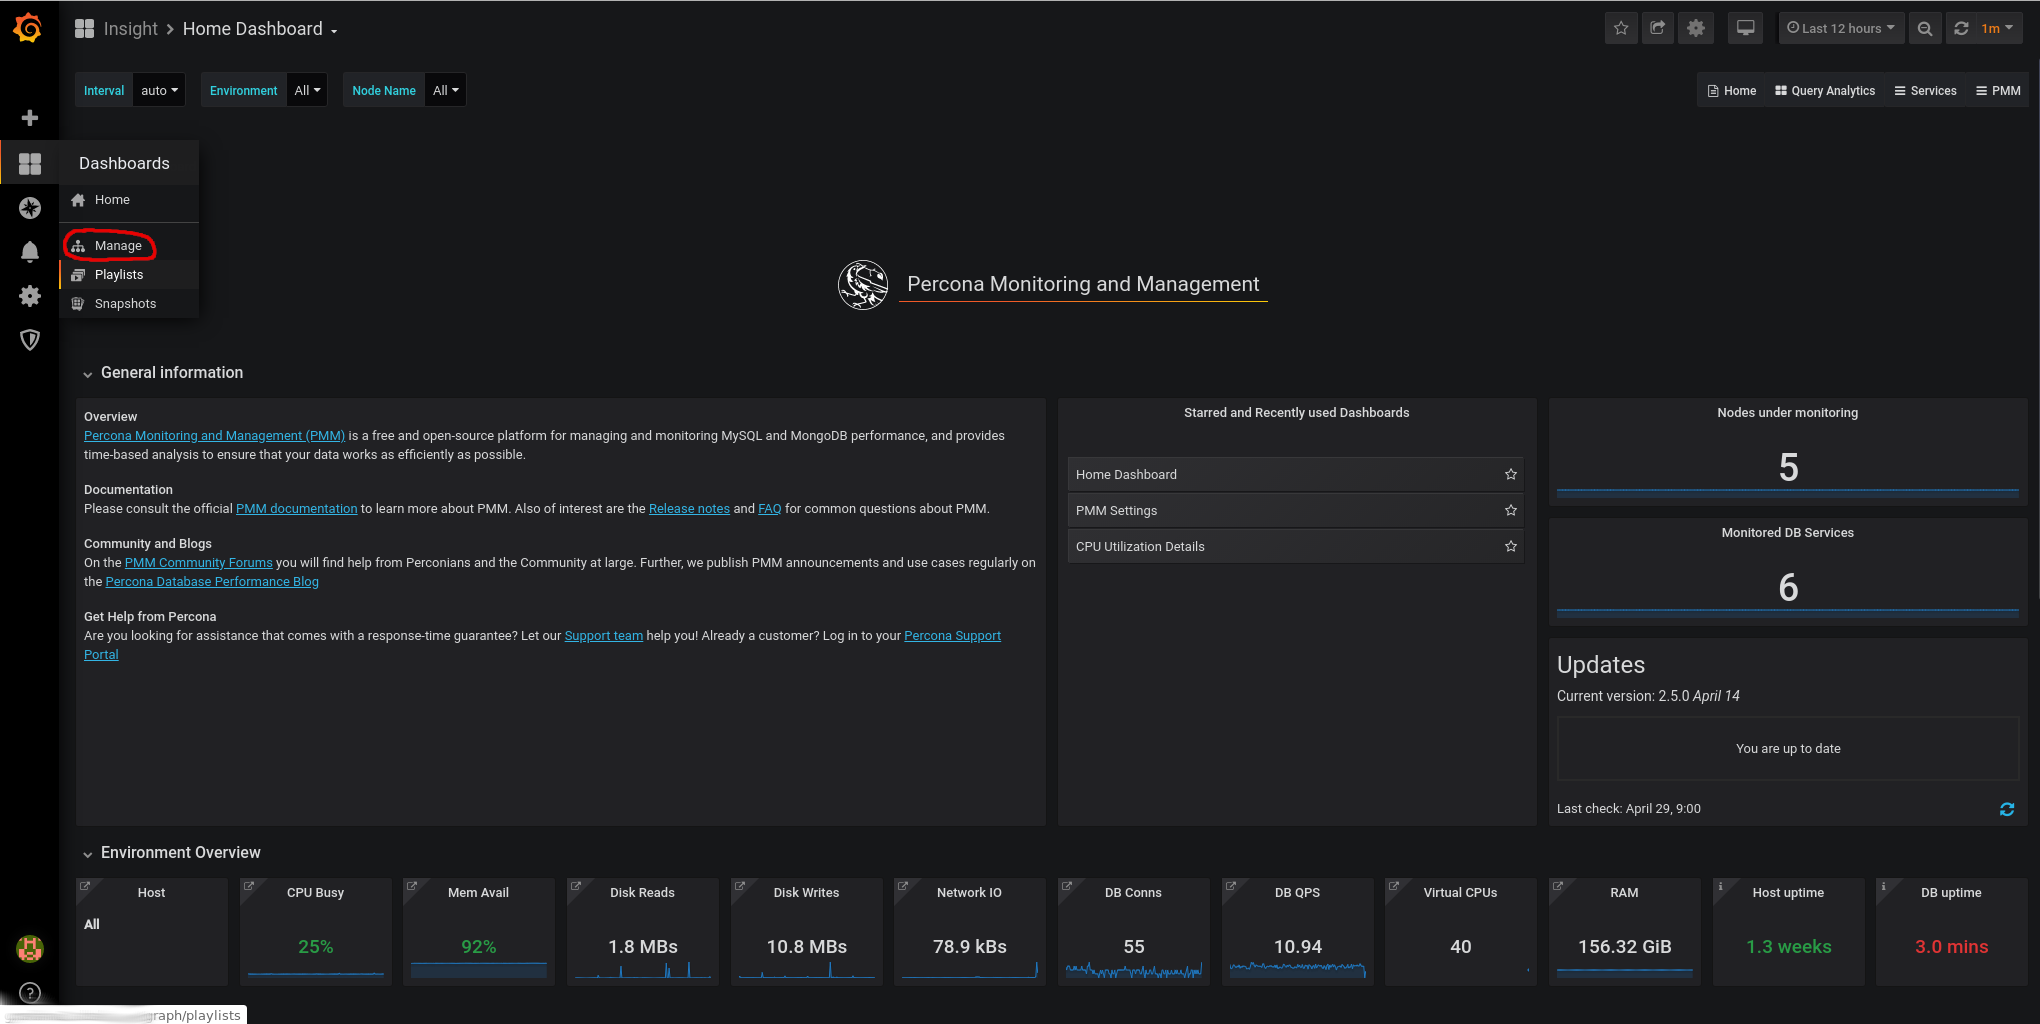
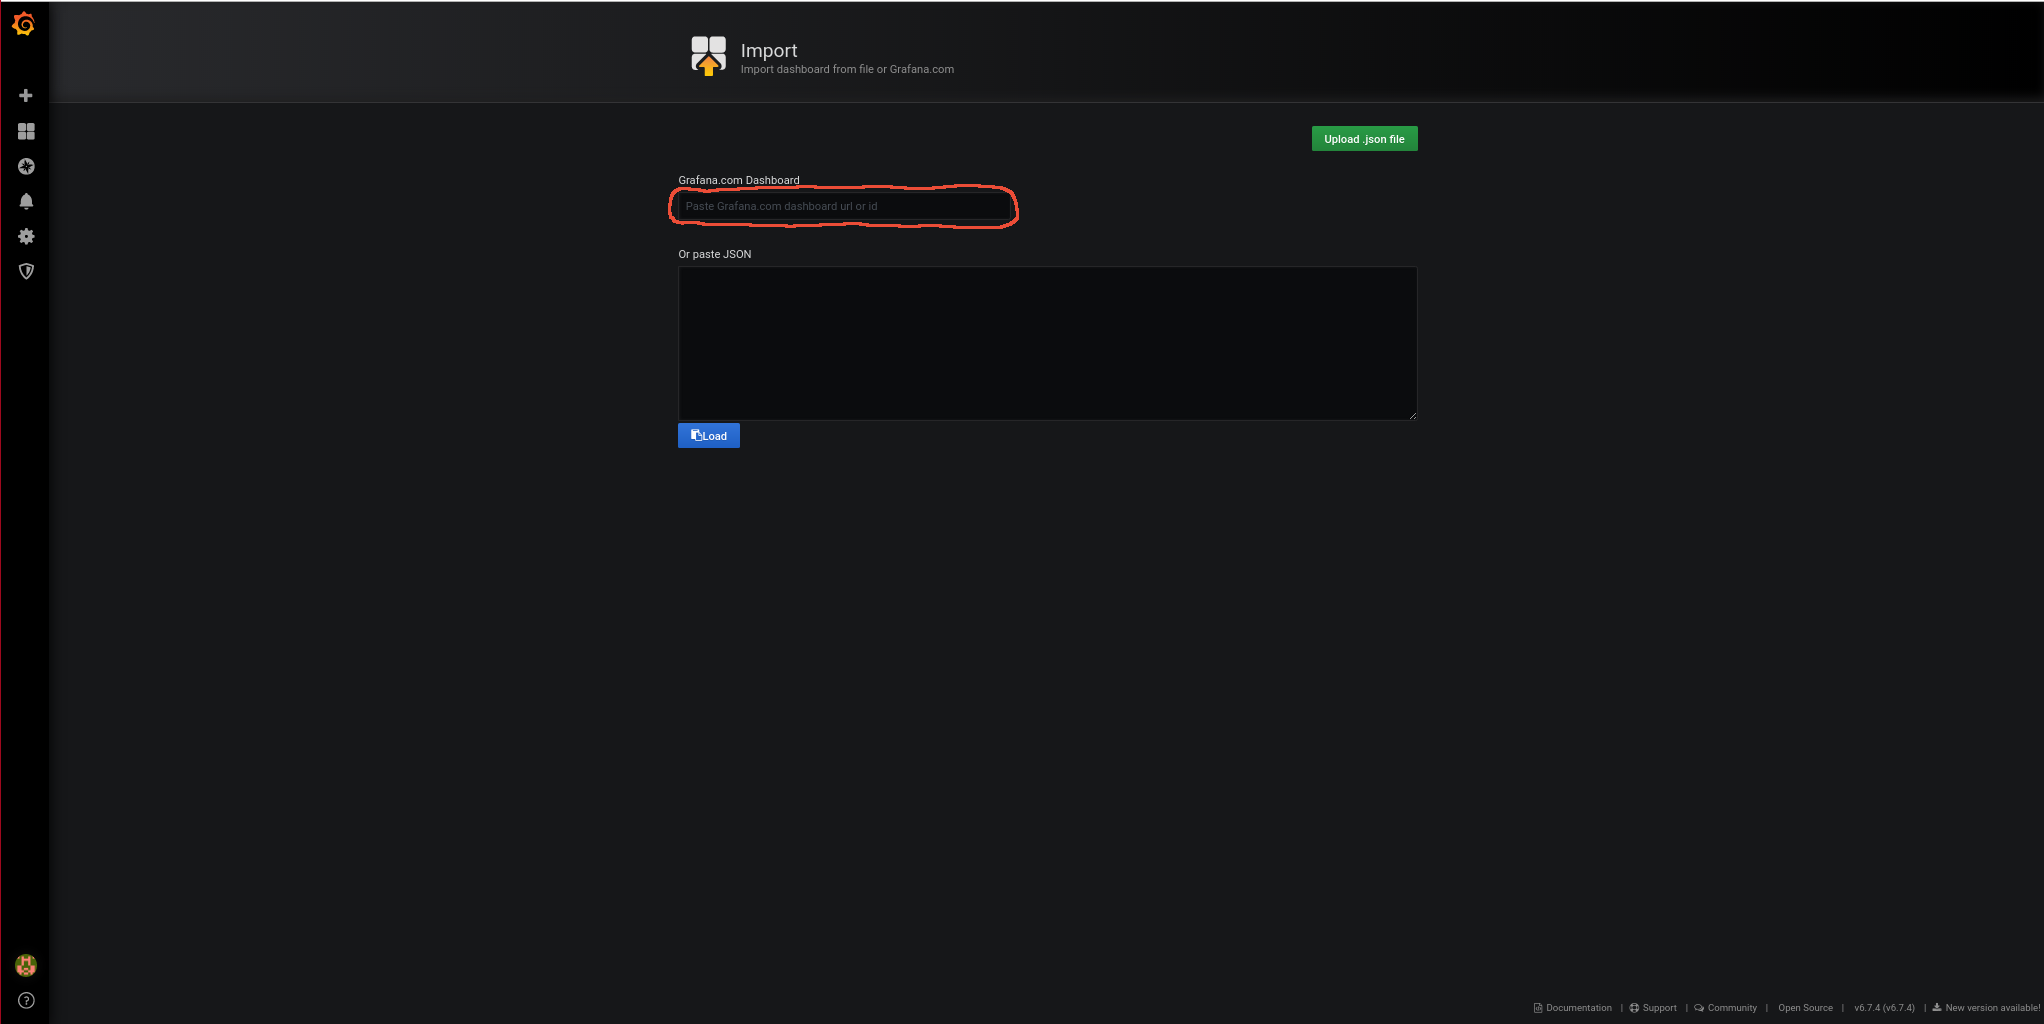
Now we load the Grafana Dashboard:
https://grafana.com/grafana/dashboards/3901
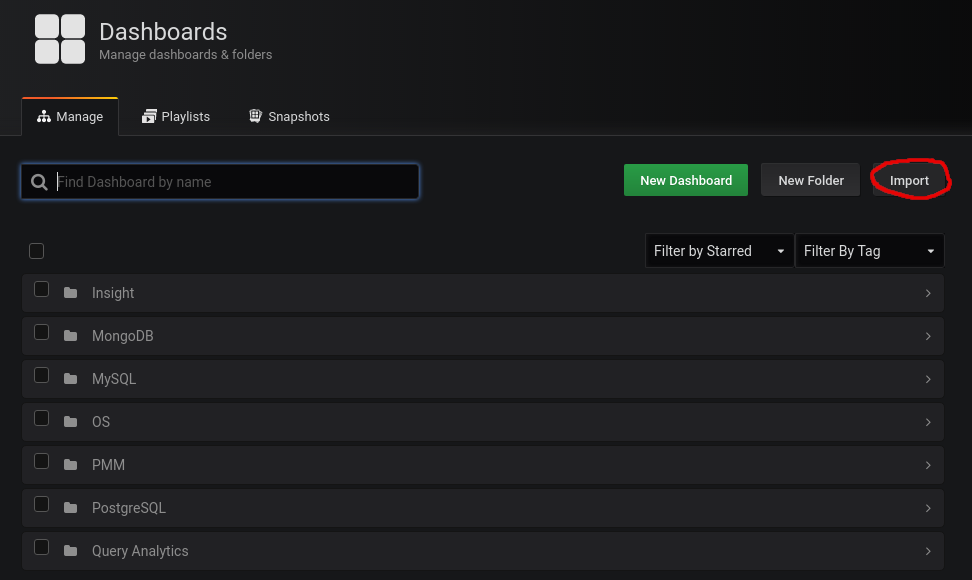
Paste the dashboard URL and import it:
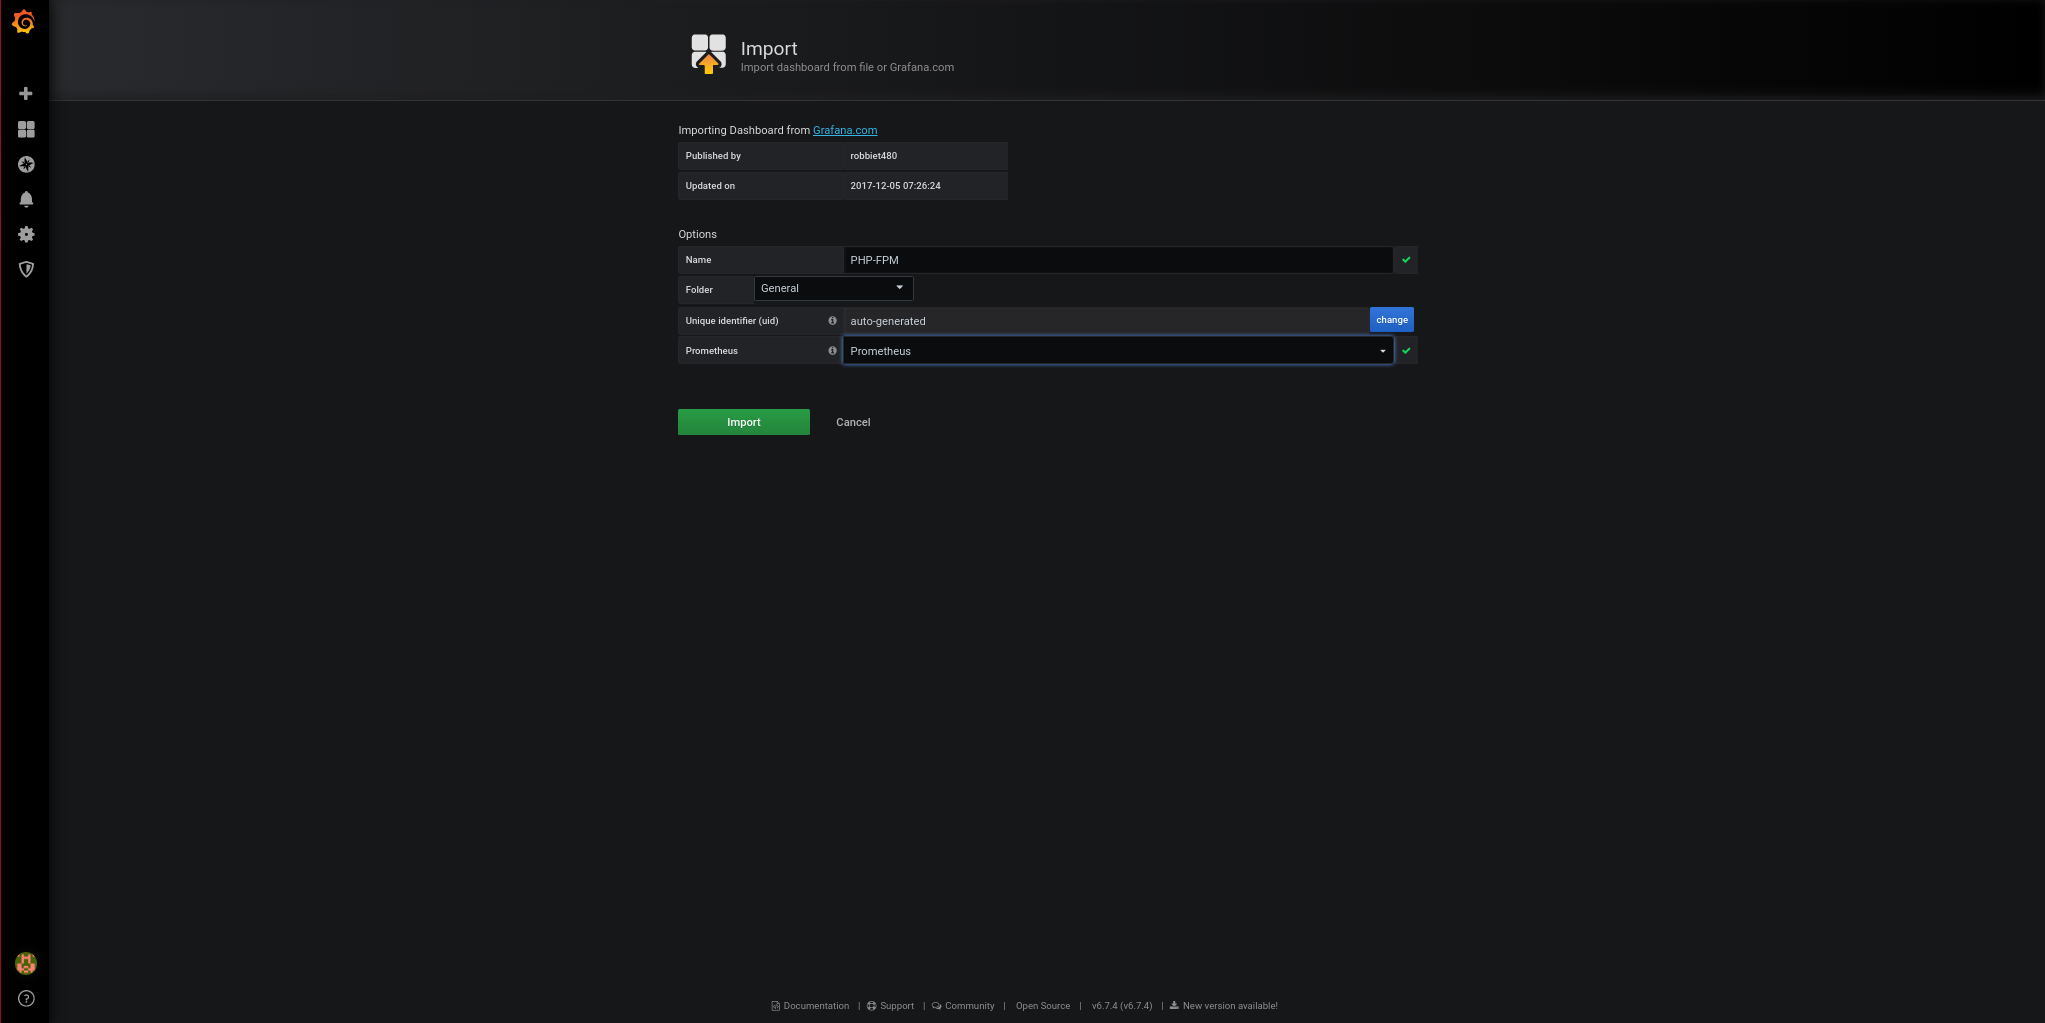
And the result is as follows: