MongoDB replicasets provide us with high availability and load balancing of reads, but this is not a panacea since if any node in the RS is not functioning correctly, the reads performed will be slower than normal. Through PMM and query analytics, we will be able to detect these types of problems and act accordingly.
Continuing with the installation of a MongoDB RS , we will set up monitoring for it.
PRIMARY
We access the MongoDB CLI to create the monitoring user:
We create the monitoring user:
use admin
db.getSiblingDB("admin").createUser({
    user: "pmm",
    pwd: "PASSWORDMONIT",
    roles: [
        { role: "clusterMonitor", db: "admin" },
        { role: "readAnyDatabase", db: "admin" }
    ]
})
NOTE: If we use an arbiter, we must remember that the arbiter does NOT replicate data, therefore it will not have the user used by PMM2 and it will be impossible to create it manually since it is not PRIMARY. In such a case, it is not possible to monitor it with PMM2. Anyway, the use of arbiters in Mongo is discouraged.
ALL NODES
If we want basic monitoring, we simply add the exporter:
But if we want to use Percona’s query analyzer, we will have to enable the query log, for which we will have to start MongoDB with certain parameters:
The parameters are as follows:
- profile: If its value is 0, no profiling will be performed. If its value is 1, queries that take longer than slowms will be logged. If its value is 2, all queries will be logged.
- slowms: Threshold above which the query will be logged if profile is set to 1.
- slowOpSampleRate: Value from 0 to 1, indicates the ratio of slow queries to log.
These parameters can be specified in the MongoDb configuration file:
operationProfiling:
    mode: slowOp
    slowOpThresholdMs: 200
    slowOpSampleRate: 0.2
The mode parameter allows several values:
- off: Query logging disabled
- slowOp: Only slow queries are logged
- all: All queries are logged
Restart the service:
Add the MongoDb exporter indicating the monitoring user and password:
Check that the exporter has been added:
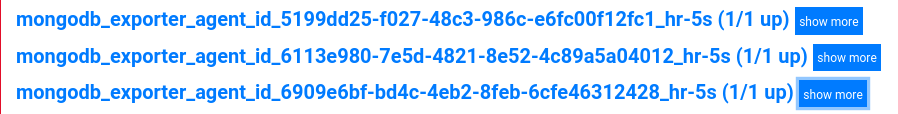
In targets we can see the 3 exporters:
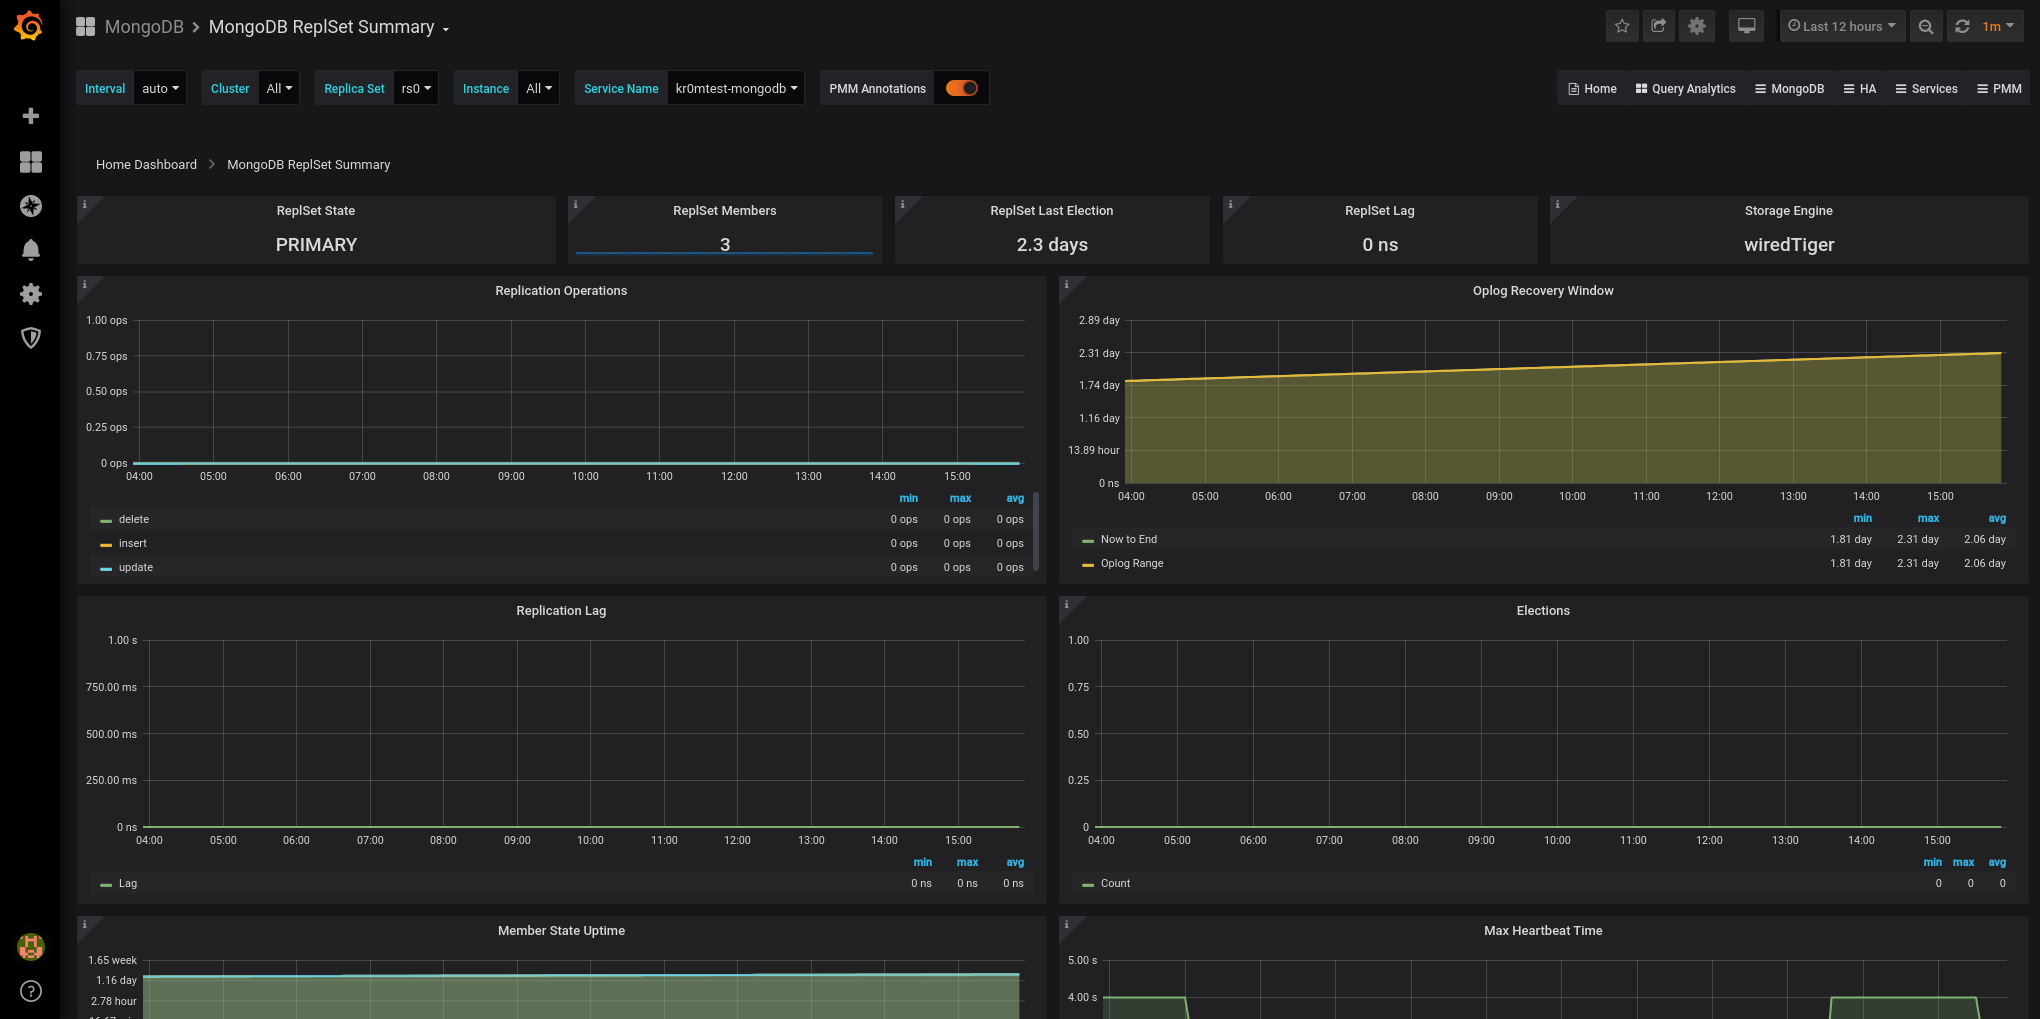
In Grafana, the RS charts:
NOTE: If we already had any of the nodes monitored before putting it in the RS, we will have to remove the exporter and put it back.
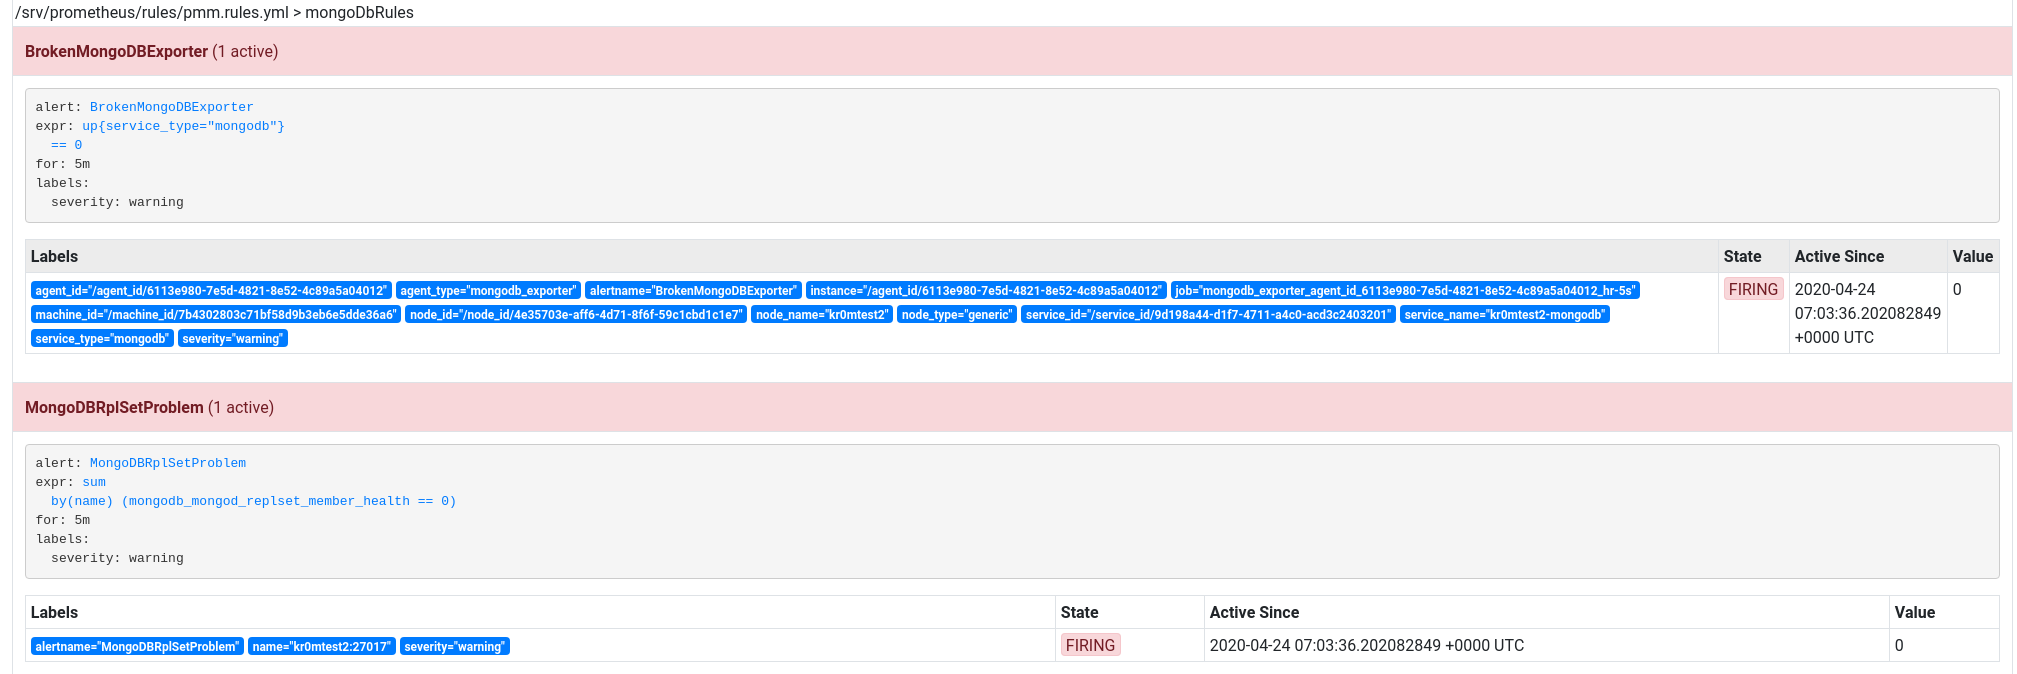
BrokenMongoDBExporter alerts will have a warning severity since there are several nodes in an RS.
- name: mongoDbRules
  rules:
  - alert: BrokenMongoDBExporter
    expr: up{service_type="mongodb"} == 0
    for: 5m
    labels:
      severity: warning

  - alert: MongoDBRplSetProblem
    expr: sum(mongodb_mongod_replset_member_health == 0) by (name)
    for: 5m
    labels:
      severity: warning
NOTE: If we do not do the sum by (name) in the alert, when a node in the RS falls, several alerts will appear, one for each active node.
We can see the alert when turning off an RS node:
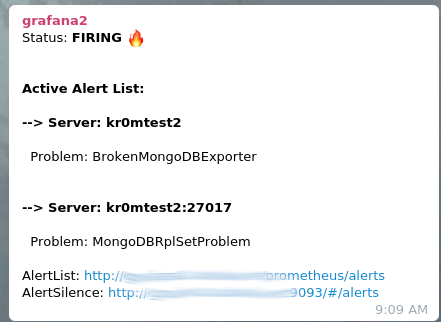
If we have followed the guide on
Alertmanager
, we will see alerts like this in Telegram:
Normal monitoring in PMM works based on an exporter installed on the server, but if we do not have access to this server, it is possible to monitor the database through access to the database:
PMM2: Remote services monitoring – monitor MySQL, PostgreSQL, and MongoDB from PMM Server without the need for client installation