It is useless to have a PMM server if we do not add any client to the monitoring. In this article, I explain how to install it with basic metrics on both Ubuntu and Gentoo.
We install the client as follows:
Ubuntu:
apt install gpg
dpkg -i percona-release_latest.generic_all.deb
apt-get update
apt-get install pmm2-client
pmm-admin config –server-insecure-tls –server-url=https://admin:PASSWORD@PMM_SERVER:443
Gentoo:
tar xvzf pmm2-client-2.4.0.tar.gz
cd pmm2-client-2.4.0
./install_tarball
We add the installed binaries to the path:
We make the permanent change:
PATH=$PATH:/usr/local/percona/pmm2/bin
export BASH_ENV=~/.bashrc
if [ -f ~/.bashrc ]; then source ~/.bashrc; fi
To make the exporters work, we must first configure/start the agent:
If we set it up incorrectly, the second time we run it, it will tell us:
Failed to register pmm-agent on PMM Server: Node with name “kr0mtest” already exists..
We will have to add the option: –force to the command.
We manually start the pmm-agent to check that it does not give any problems:
In another console, we can see the exporters:
Service type  Service name         Address and port  Service ID

Agent type                  Status     Agent ID                                        Service ID
pmm_agent                   Connected  /agent_id/aba88792-1544-420a-a091-cbffe93f9232
node_exporter               Running    /agent_id/d35f58b3-a4e8-4367-8659-d726adf3641a
We demonize the agent:
nohup pmm-agent --config-file=/usr/local/percona/pmm2/config/pmm-agent.yaml &
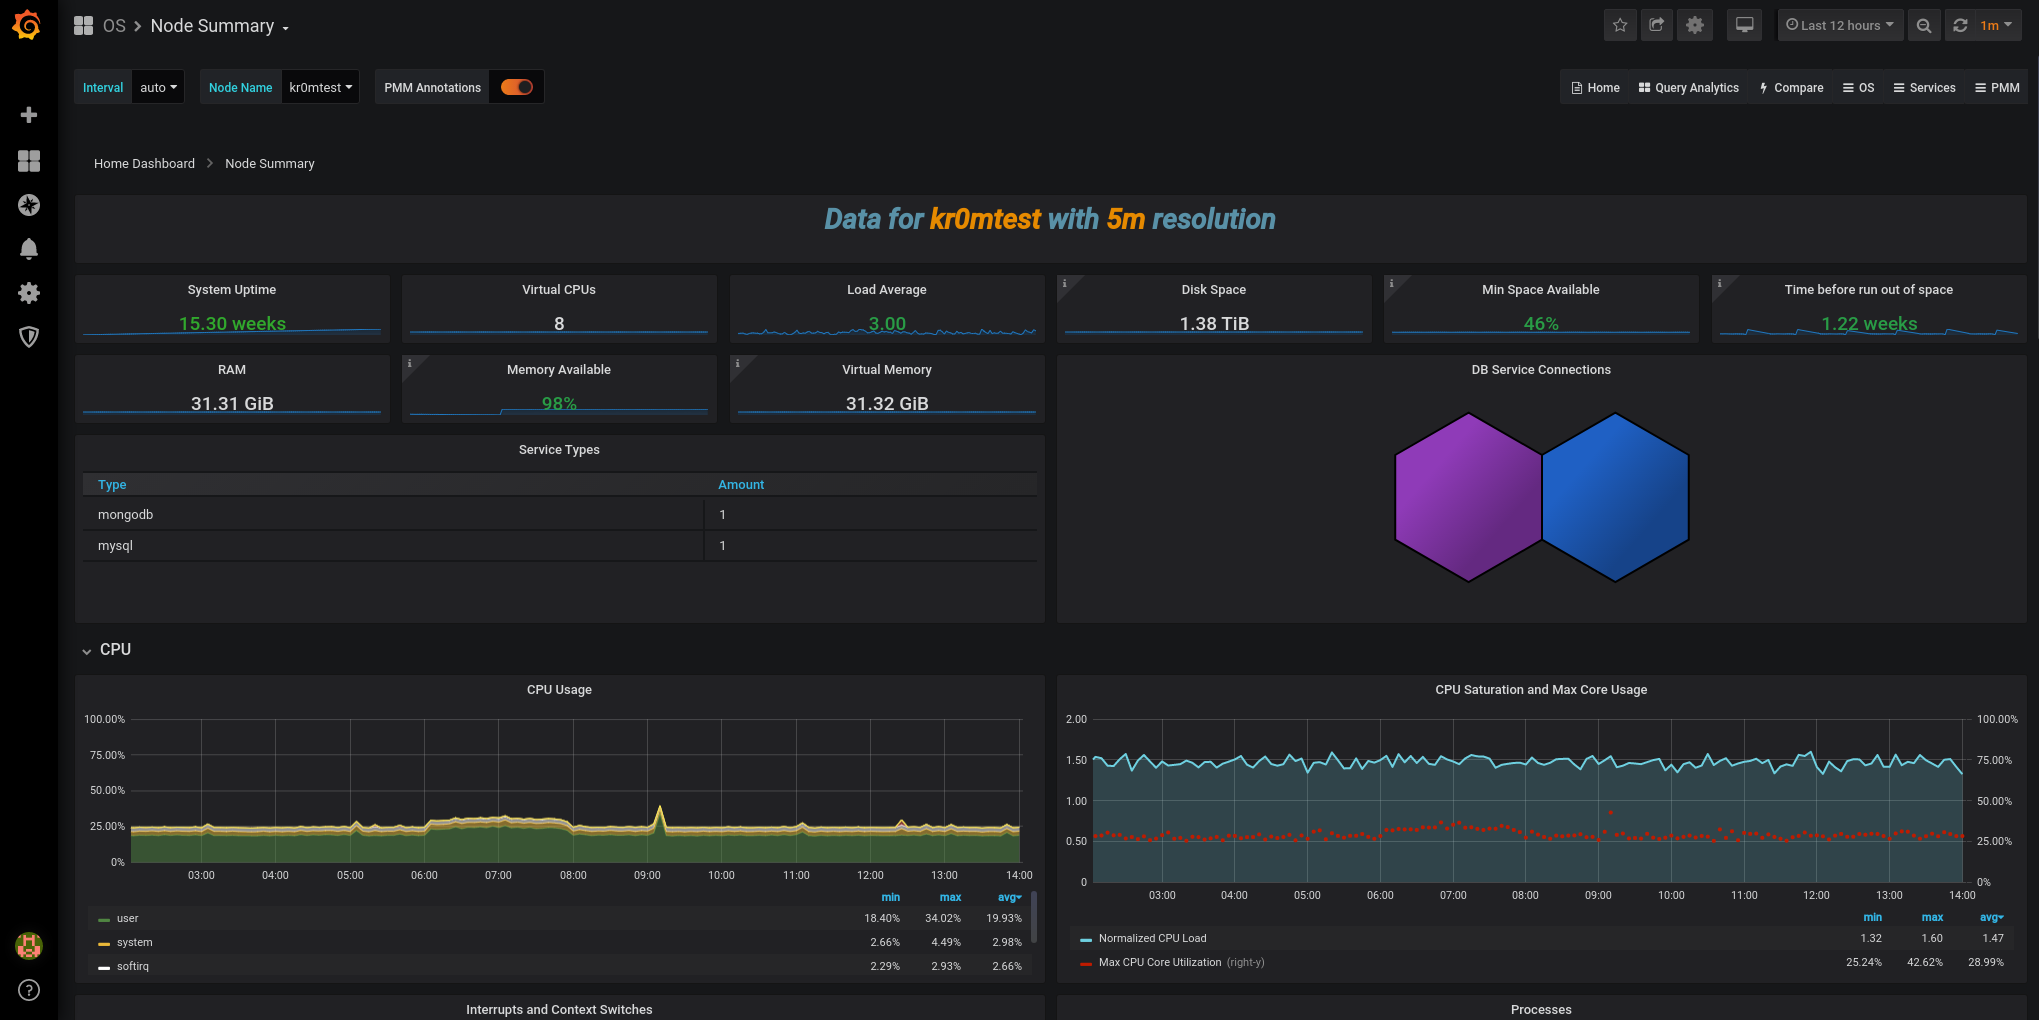
In the Grafana interface, we can already see data:
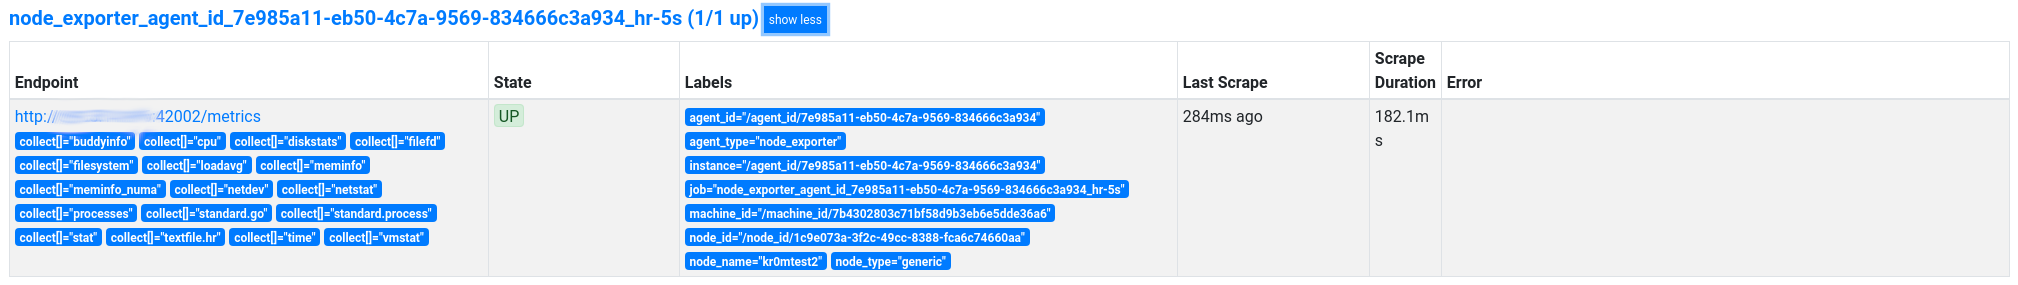
To know if we are correctly collecting a metric, we can consult it in the Prometheus interface, Status -> Targets, but it will ask for authentication, the user is always pmm and the password is the id of the exporter we are consulting.
We consult the exporters on the server:
Service type  Service name         Address and port  Service ID

Agent type                  Status     Agent ID                                        Service ID
pmm_agent                   Connected  /agent_id/d94f4797-68df-4832-835f-e2b742f3a189
node_exporter               Running    /agent_id/7e985a11-eb50-4c7a-9569-834666c3a934
In this case, there is only one whose password is: /agent_id/7e985a11-eb50-4c7a-9569-834666c3a934
It can also be consulted in the Prometheus web interface in the agent_id tag: