By monitoring MySQL databases with PMM, we will be able to diagnose query problems, slow queries, obtain information from the performance schema, QPS, and many more metrics. All of this, combined with alerts, makes PMM a very complete database monitoring system.
The first step will be to create the MySQL monitoring user. We must keep in mind that if it is a slave and all databases are being replicated, we will have to create the user on the master.
The PMM client does not support caching_sha2_password authentication, so we create the user with the mysql_native_password plugin:
CREATE USER pmm@'127.0.0.1' IDENTIFIED BY 'PASSWORD' WITH MAX_USER_CONNECTIONS 10;
ALTER USER pmm@'127.0.0.1' IDENTIFIED WITH mysql_native_password BY 'PASSWORD';
SELECT user,plugin,host FROM mysql.user WHERE user='pmm';
+------+-----------------------+-----------+
| user | plugin                | host      |
+------+-----------------------+-----------+
| pmm  | mysql_native_password | 127.0.0.1 |
+------+-----------------------+-----------+

GRANT SELECT, PROCESS, SUPER, REPLICATION CLIENT, RELOAD ON *.* TO 'pmm'@'127.0.0.1';
GRANT SELECT, UPDATE, DELETE, DROP ON performance_schema.* TO 'pmm'@'127.0.0.1';
FLUSH PRIVILEGES;
If we want basic monitoring, just add the exporter:
But if we want to be able to use Percona’s query analytics, we must first configure the database. Metrics can be obtained from both the slowlog (MySQL >=5.1) and the performance schema table (MySQL >=5.6), if not specified, it will use slowlog by default.
SLOWLOG:
This is the option that presents greater compatibility with different versions of MySQL, the information is more detailed than that provided by performance schema but penalizes server performance to a greater extent.
If we want to have a complete analysis, we must assign the long_query_time variable to 0 to capture all queries, but if the server receives many QPS, performance may be affected.
SET global slow_query_log='ON';
If it is a Slave:
SET global slow_query_log='ON';
SET global log_slow_slave_statements='ON';
We indicate that we want to log all queries:
SET global long_query_time=0;
The equivalent in the configuration file would be:
[mysqld]
slow_query_log = ON
long_query_time = 0
#log_slow_slave_statements='ON'
Perhaps the most reasonable option is to capture all queries for a period of time and analyze the results to find out from what time we should consider the query as slow, then reconfigure the long_query_time to a value close to this.
InnoDB provides interesting metrics and does not penalize performance too much, so we enable them:
SET GLOBAL innodb_monitor_enable=all
To make it permanent:
[mysqld]
innodb_monitor_enable=all
Restart MySQL:
Add the exporter:
Check that the exporter has been added:
Service type  Service name         Address and port  Service ID
MySQL         kr0mtest-mysql       127.0.0.1:3306    /service_id/d3a76048-ea77-4016-9614-d116a6017f05

Agent type                  Status     Agent ID                                        Service ID
pmm_agent                   Connected  /agent_id/70831d60-cca4-43dc-9ac1-ed6e24ea69dc
node_exporter               Running    /agent_id/7afe5727-f389-4382-a8a9-3d345a012d74
mysqld_exporter             Running    /agent_id/da7bce4d-6a68-462f-aaff-5bc58bd18ff9  /service_id/d3a76048-ea77-4016-9614-d116a6017f05
mysql_slowlog_agent         Running    /agent_id/67b8b836-d63c-42e6-b124-58b6415a697d  /service_id/d3a76048-ea77-4016-9614-d116a6017f05
PERFORMANCE SCHEMA:
Analyzing queries using performance schema is generally faster than using slow queries, performance schema is enabled by default from MySQL 5.6.6 onwards.
Check that it is enabled:
SHOW VARIABLES LIKE 'performance_schema';
+--------------------+-------+
| Variable_name      | Value |
+--------------------+-------+
| performance_schema | ON    |
+--------------------+-------+
There are some instrumentation options that are not enabled by default because they penalize performance too much, due to this there may be graphs that are not available, if we want to enable these parameters we must start MySQL with the --performance-schema-instrument parameter.
MY_ARGS="--performance-schema-instrument"
NOTE: It is not recommended to enable this option on a production server.
InnoDB provides interesting metrics and does not penalize performance too much, so we enable them:
SET GLOBAL innodb_monitor_enable=all
To make it permanent:
[mysqld]
innodb_monitor_enable=all
Restart MySQL:
Add the exporter:
Check if the exporter has been added:
Service type  Service name         Address and port  Service ID
MySQL         kr0mtest2-mysql      127.0.0.1:3306    /service_id/89269ff0-fc13-4762-8f9f-500f0bc000f1

Agent type                  Status     Agent ID                                        Service ID
pmm_agent                   Connected  /agent_id/64a3b42c-bd8d-49ff-a12b-a65ad00bcf13
node_exporter               Running    /agent_id/632231d5-9540-4a5f-b688-e23e14a48965
mysqld_exporter             Running    /agent_id/66b9221e-5a4e-45e8-9ba5-e16b249a6e34  /service_id/89269ff0-fc13-4762-8f9f-500f0bc000f1
mysql_perfschema_agent      Running    /agent_id/cdeed460-de71-4ed0-ac76-f546e2491dd8  /service_id/89269ff0-fc13-4762-8f9f-500f0bc000f1
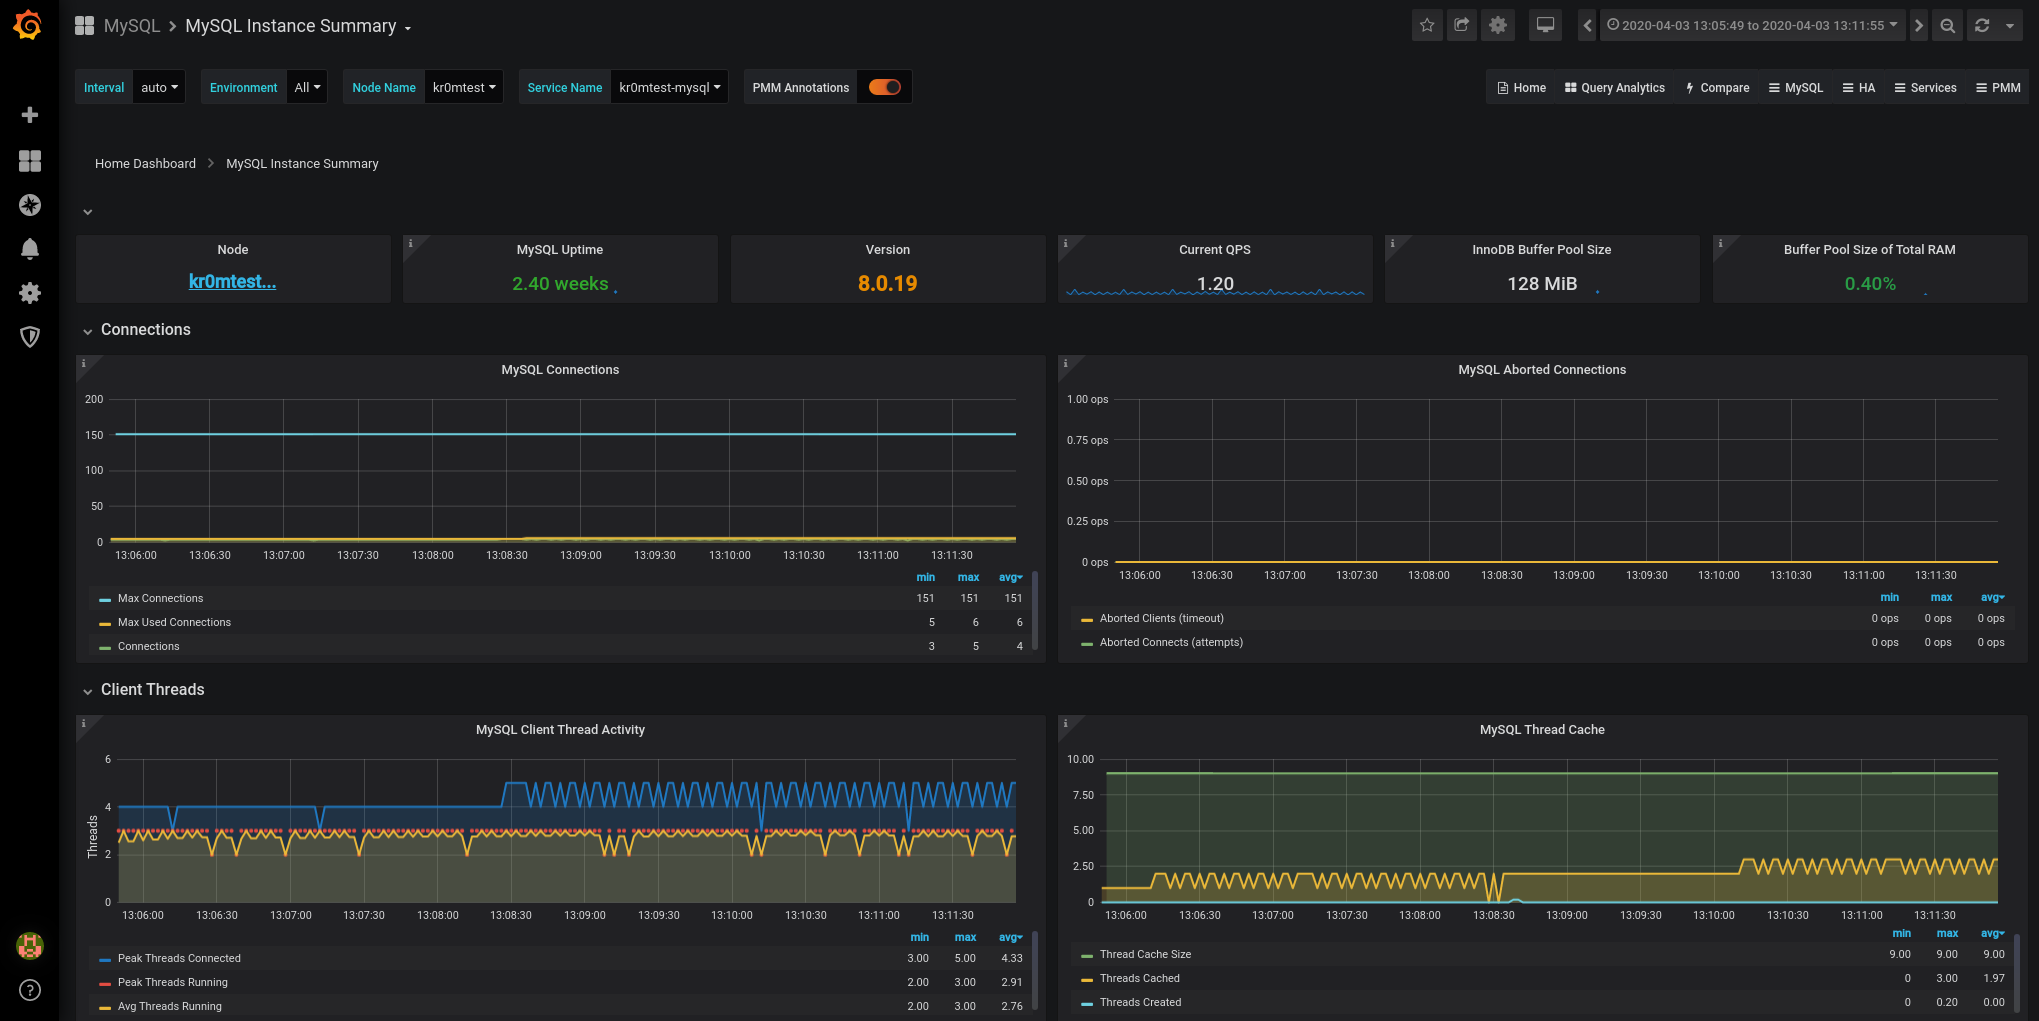
We can see the obtained metrics in the Grafana interface:
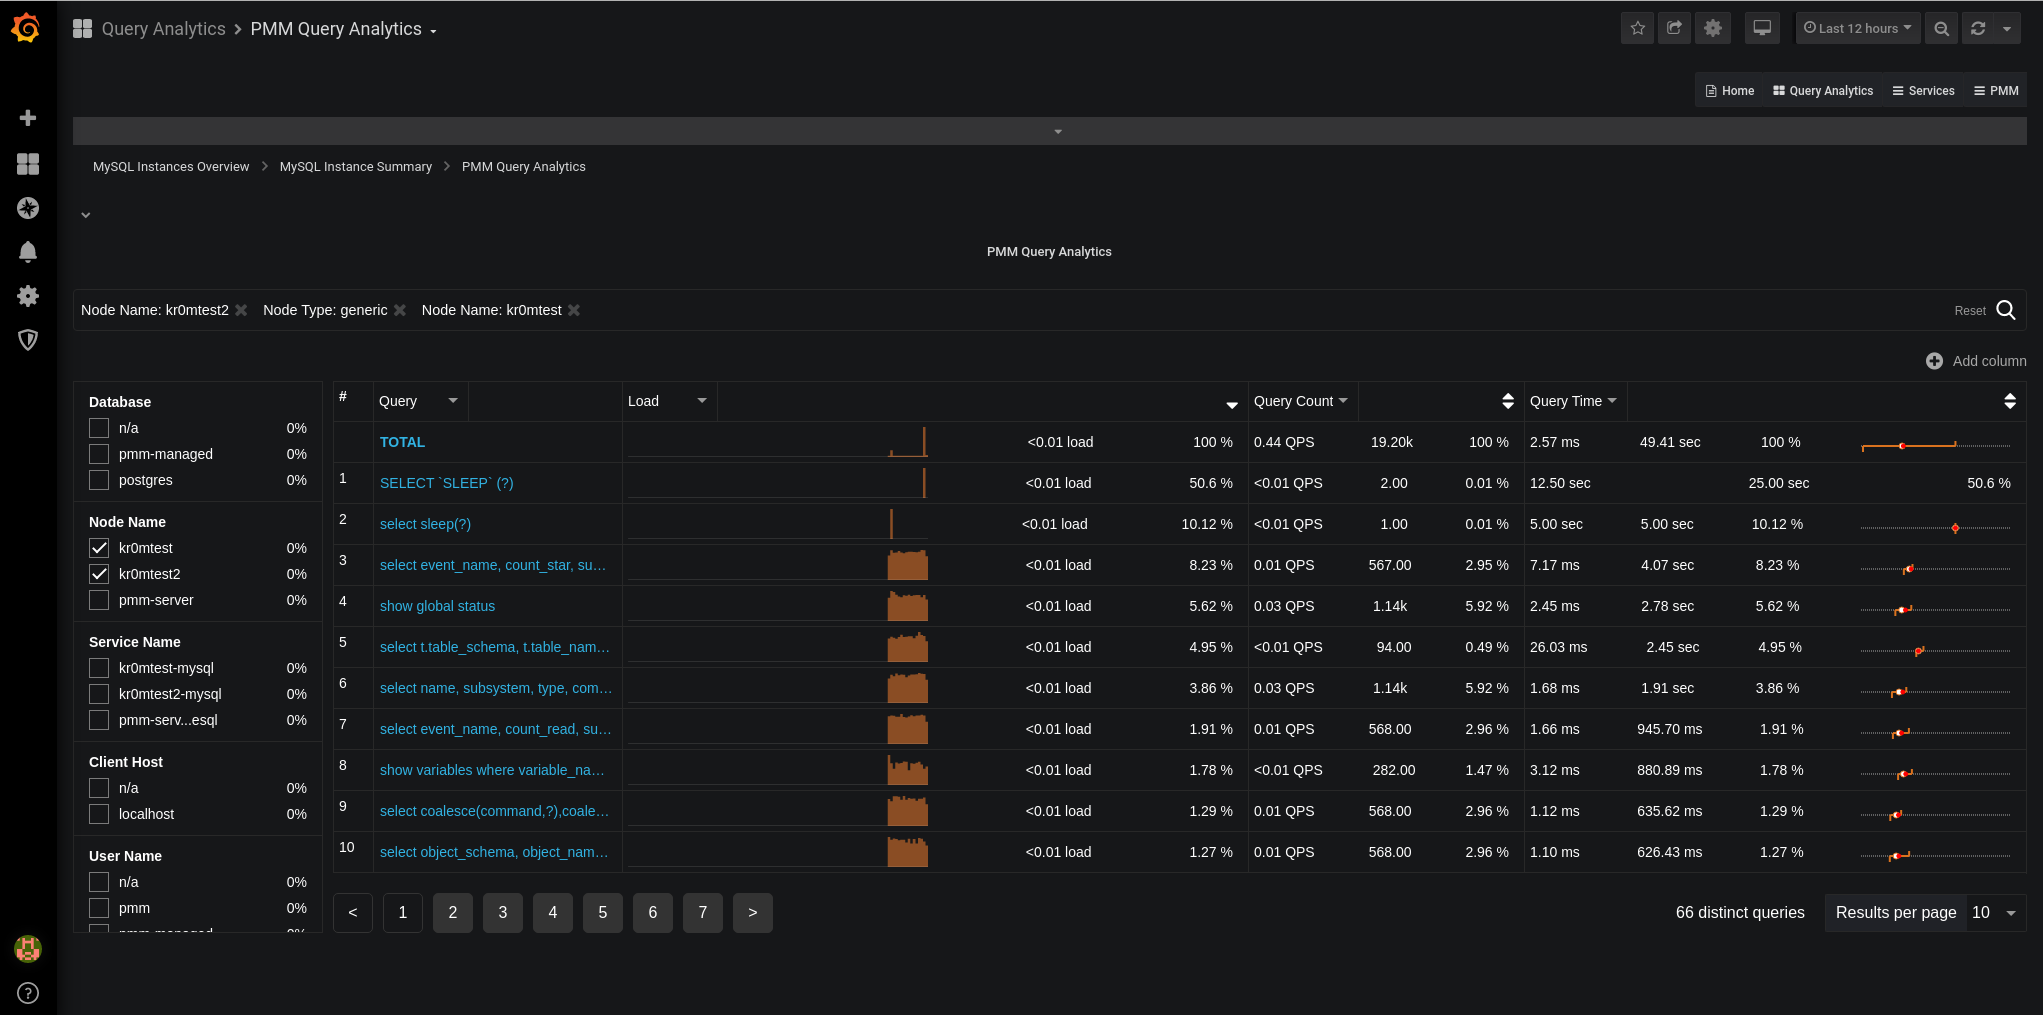
And the executed queries in the query analytics:
The corresponding Prometheus alerts would be:
groups:
- name: mysqlRules
rules:
- alert: BrokenMySQLExporter
expr: sum(up{agent_type="mysqld_exporter"} == 0) by (node_name)
for: 5m
labels:
severity: critical
- alert: MySQLDown
expr: sum(mysql_up == 0) by (node_name)
for: 5m
labels:
severity: critical
- alert: DelayedMySQLSlave
expr: mysql_slave_status_seconds_behind_master > 300
for: 30m
labels:
severity: medium
- alert: BrokenMySQLSlave
expr: mysql_slave_status_slave_sql_running == 0
for: 5m
labels:
severity: critical
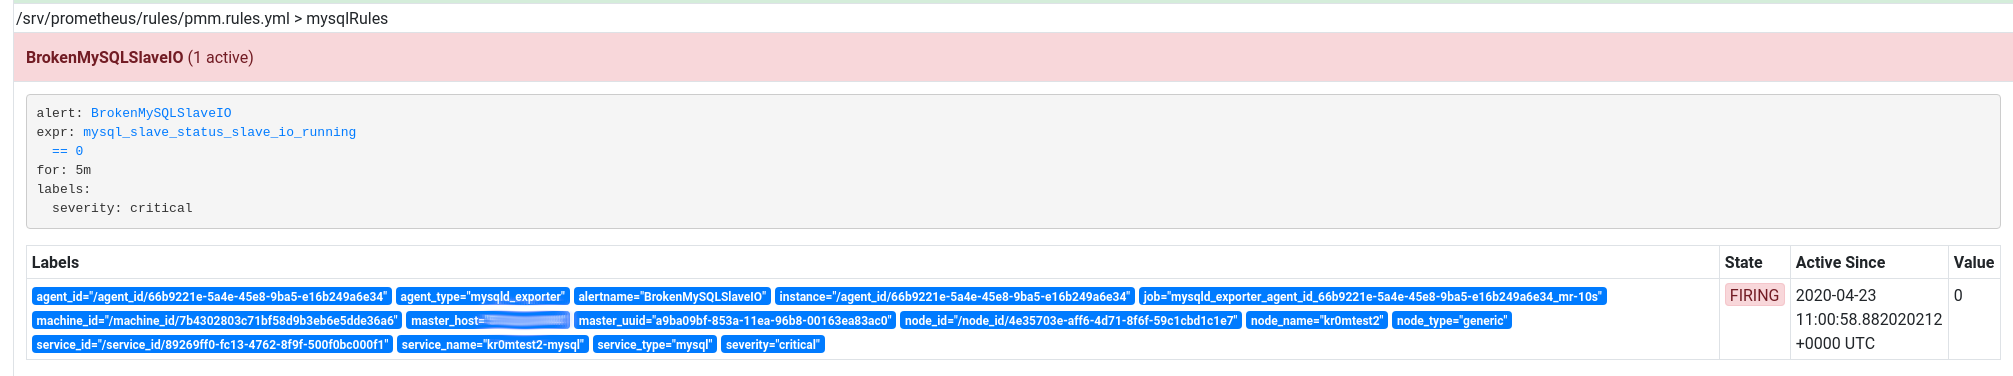
- alert: BrokenMySQLSlaveIO
expr: mysql_slave_status_slave_io_running == 0
for: 5m
labels:
severity: critical
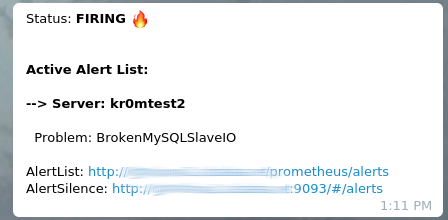
In the capture, we can see the alert of a Slave that is unable to connect to its Master:
If we have followed the guide on
Alertmanager
, we will see alerts like this in Telegram:
The normal monitoring in PMM works based on an exporter that is installed on the server, but if we do not have access to this server, it is possible to monitor the database through access to the database:
PMM2: Remote services monitoring – monitor MySQL, PostgreSQL, and MongoDB from PMM Server without the need for client installation