Monitoring our MongoDb databases with PMM will allow us to easily identify slow queries, bottlenecks, error rates, and many other metrics. All of this will be useful for finding bugs or potentially optimizable queries.
Continuing with the basic installation , we are going to set up monitoring. The only requirement is to have a MongoDb version >= 3.2.
We access the MongoDb CLI to create the monitoring user:
We create the monitoring user:
use admin
db.getSiblingDB("admin").createUser({
    user: "pmm",
    pwd: "PASSWORDMONIT",
    roles: [
        { role: "clusterMonitor", db: "admin" },
        { role: "readAnyDatabase", db: "admin" }
    ]
})
If we want basic monitoring, we simply add the exporter:
But if we want to use the Percona query analyzer, we will have to enable the query log. To do this, we will have to start MongoDb with certain parameters:
The parameters are as follows:
- profile: If its value is 0, no profiling will be performed. If its value is 1, queries that take longer than slowms will be logged. If its value is 2, all queries will be logged.
- slowms: Threshold above which the query will be logged if profile is set to 1.
- slowOpSampleRate: Value from 0 to 1, indicates the ratio of slow queries to log.
These parameters can be specified in the MongoDb configuration file:
operationProfiling:
    mode: slowOp
    slowOpThresholdMs: 200
    slowOpSampleRate: 0.2
The mode parameter allows several values:
- off: Query logging disabled
- slowOp: Only slow queries are logged
- all: All queries are logged
We restart the service:
We add the MongoDb exporter indicating the monitoring user and password:
We check that the exporter has been added:
Service type  Service name         Address and port  Service ID
MySQL         kr0mtest-mysql       127.0.0.1:3306    /service_id/d3a76048-ea77-4016-9614-d116a6017f05
MongoDB       kr0mtest-mongodb     127.0.0.1:27017   /service_id/947e3cd6-1c07-4da2-a762-6e8ee6350264

Agent type                  Status     Agent ID                                        Service ID
pmm_agent                   Connected  /agent_id/70831d60-cca4-43dc-9ac1-ed6e24ea69dc
node_exporter               Running    /agent_id/7afe5727-f389-4382-a8a9-3d345a012d74
mysqld_exporter             Running    /agent_id/da7bce4d-6a68-462f-aaff-5bc58bd18ff9  /service_id/d3a76048-ea77-4016-9614-d116a6017f05
mongodb_exporter            Running    /agent_id/5199dd25-f027-48c3-986c-e6fc00f12fc1  /service_id/947e3cd6-1c07-4da2-a762-6e8ee6350264
mysql_slowlog_agent         Running    /agent_id/67b8b836-d63c-42e6-b124-58b6415a697d  /service_id/d3a76048-ea77-4016-9614-d116a6017f05
mongodb_profiler_agent      Running    /agent_id/f7fff282-50cd-46c0-8e65-62633d82b160  /service_id/947e3cd6-1c07-4da2-a762-6e8ee6350264
The Prometheus alerts would be as follows:
- name: mongoDbRules
  rules:
  - alert: BrokenMongoDBExporter
    expr: up{service_type="mongodb"} == 0
    for: 5m
    labels:
      severity: critical
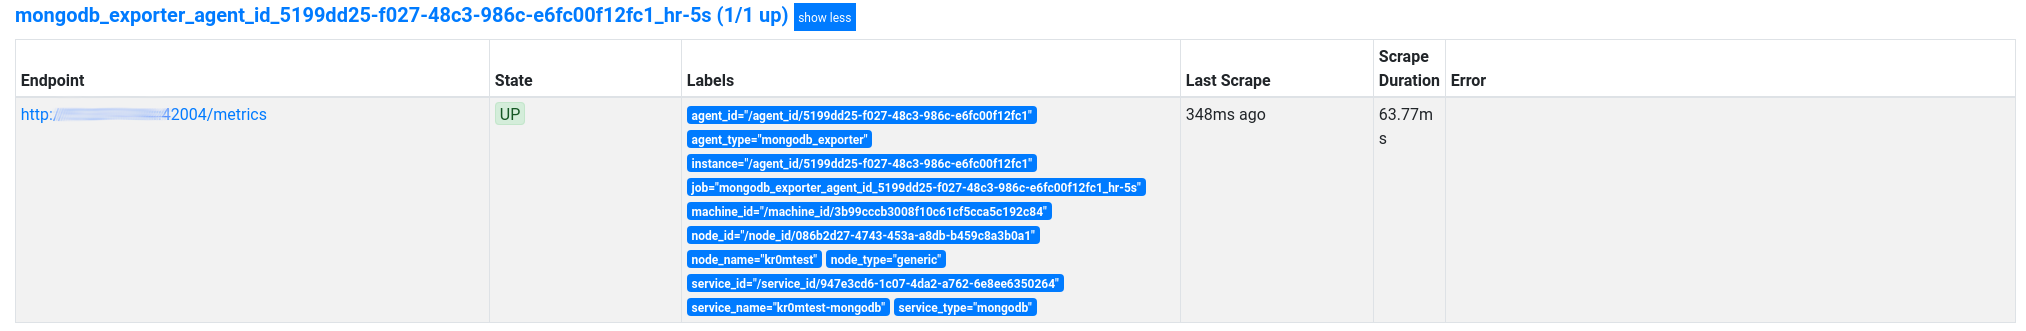
In targets we can see the exporter:
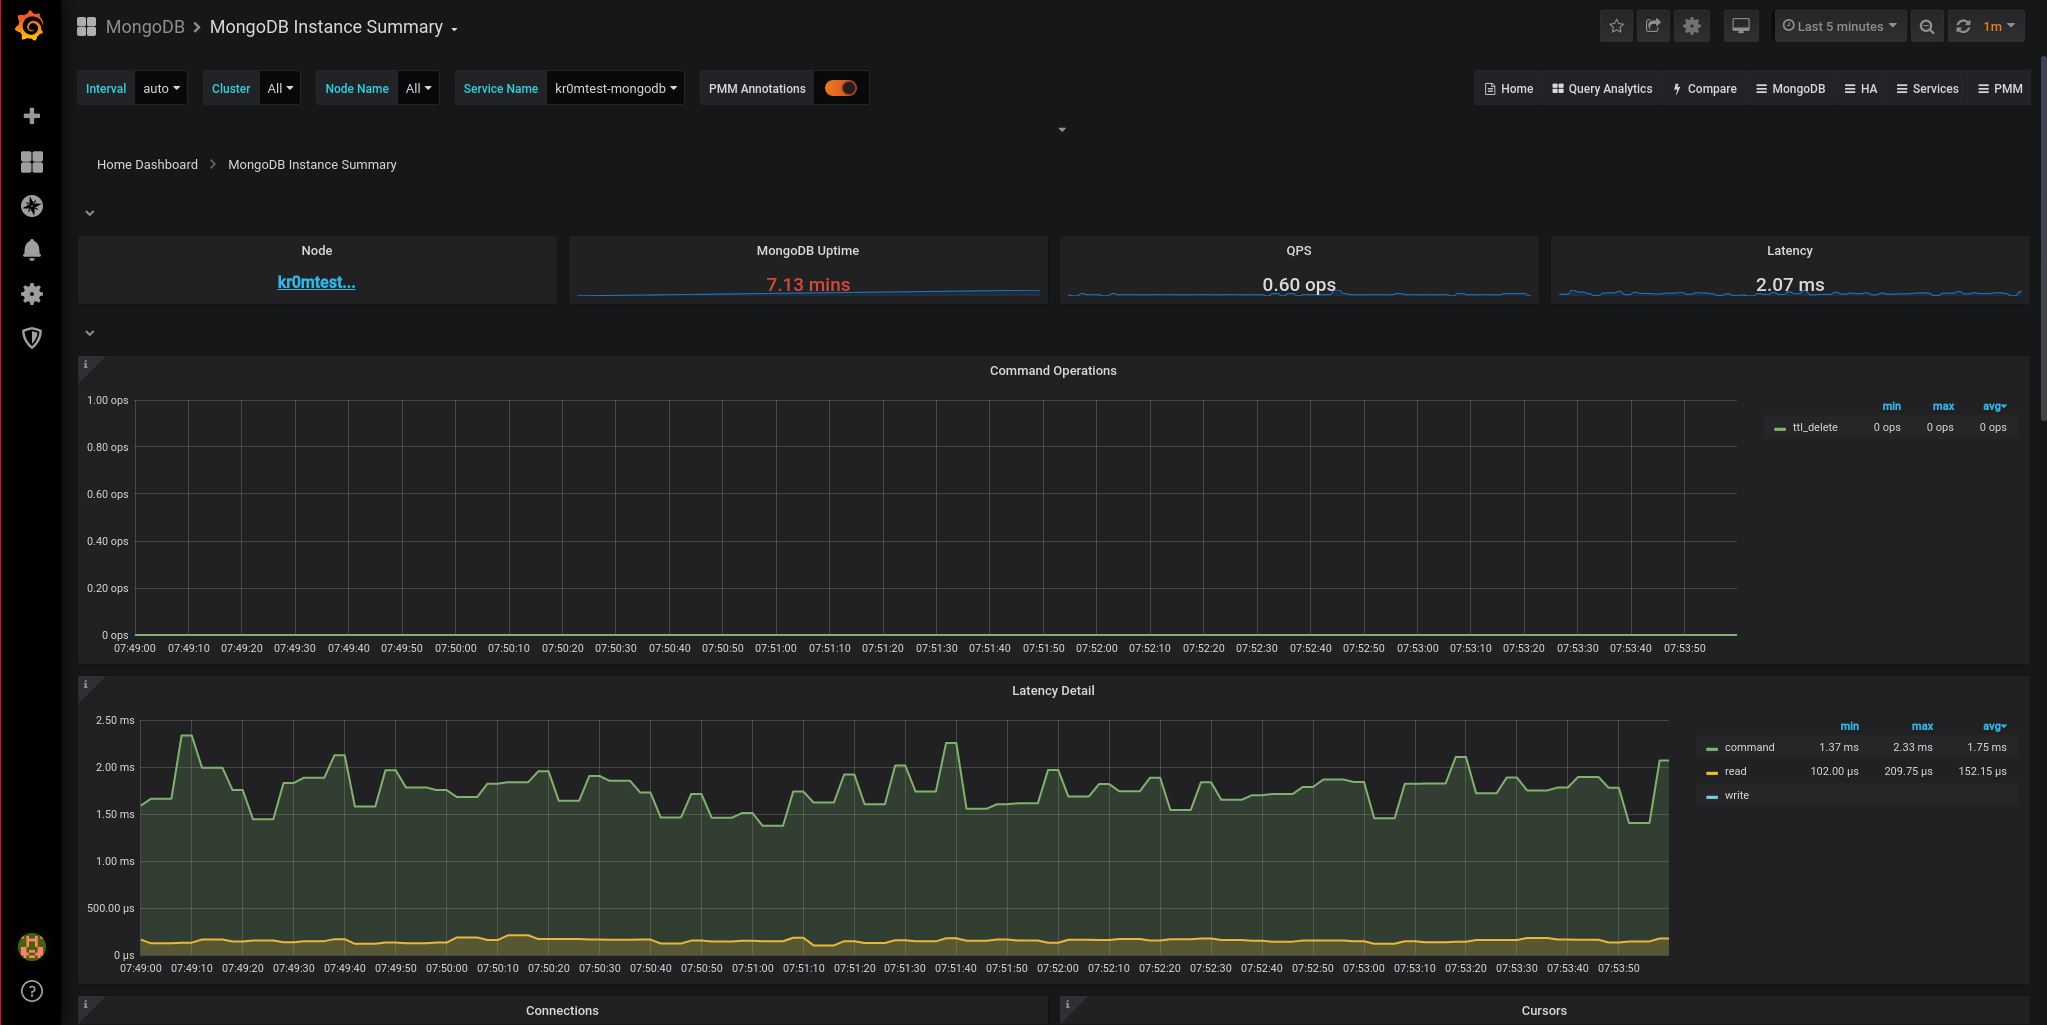
In Grafana, the graphs of the metrics:
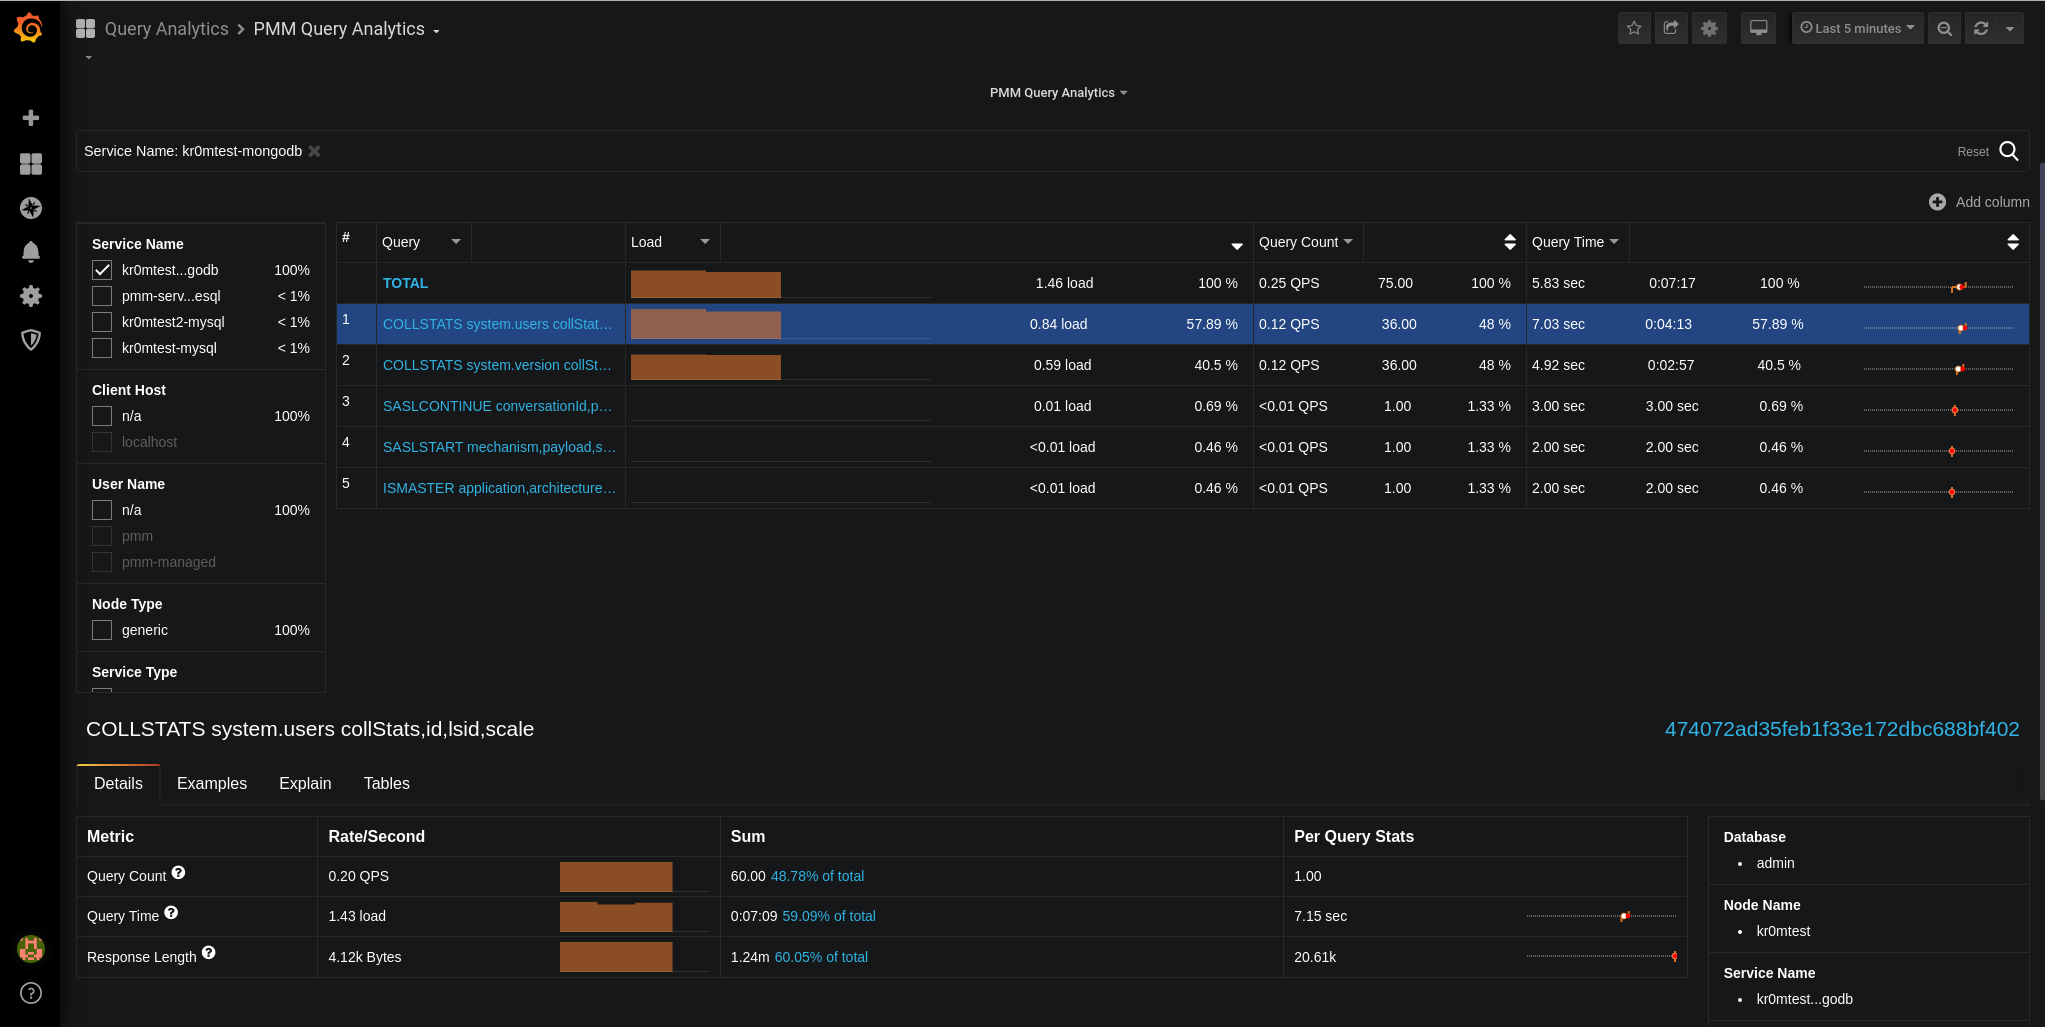
We can see the queries in the query analytics:
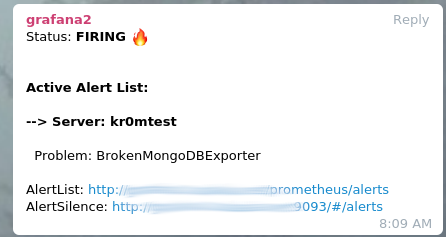
If we stop the service, we see the alert:

If we have followed the guide on
Alertmanager
, we will see alerts like this in Telegram:
Normal monitoring in PMM works based on an exporter that is installed on the server, but if we do not have access to this server, it is possible to monitor the database by accessing the database:
PMM2: Remote services monitoring – monitor MySQL, PostgreSQL, and MongoDB from PMM Server without the need for client installation