Alertmanager is the alert manager for Prometheus, it is responsible for notifying alarms to the different receivers that we configure, these receivers can be as simple as sending an email or as complicated as calling a remote API, in this way we will achieve an integration with services such as Telegram, Slack, Email or Xmpp among others.
We start by installing the Telegram bot using Docker as usual in the PMM articles.
First, we install the necessary Go dependencies for binary compilation:
mkdir go
export GOPATH=/root/go
export GOPATH=/root/go
export GOPATH=$(go env GOPATH)
go get gopkg.in/telegram-bot-api.v4
go get golang.org/x/crypto/bcrypt
The image construction from Docker is broken, so we compile the prometheus_bot binary on our server and generate the Docker image:
cd prometheus_bot
sed -i ‘1d’ main.go
sed -i ‘1 i\package main’ main.go
We compile exactly the same way as it would be done in CT Alpine:
CGO_ENABLED=0 GOOS=linux go build -v -a -installsuffix cgo -o prometheus_bot
NOTE: With a make it compiles but then Alpine cannot find the binary even though it exists:
[FATAL tini (7)] exec /prometheus_bot failed: No such file or directory
So we run make clean instead of make.
For some reason, the default Dockerfile starts the bot using tini and leaves two processes running, which causes problems. We create our own:
FROM alpine:3.11
COPY prometheus_bot /
COPY config.yaml /
COPY template.tmpl /
RUN apk add --no-cache ca-certificates tzdata tini
USER nobody
EXPOSE 9087
ENTRYPOINT ["/prometheus_bot"]
In the configuration, we will indicate the Telegram token, the template to use, and the time zone:
telegram_token: XXXXX:YYYYYYYYYYY
template_path: "template.tmpl"
time_zone: "Europe/Madrid"
split_token: "|"
My template would look like this:
{{if eq .Status "firing"}}
Status: <b>{{.Status | str_UpperCase}} 🔥 </b>
{{end}}
{{if eq .Status "resolved"}}
Status: <b>{{.Status | str_UpperCase}} ✅ </b>
{{end}}
<b>Active Alert List:</b>
{{- range $val := .Alerts}}
{{if .Labels.node_name }}
<b>--> Server: {{.Labels.node_name}}</b>
{{else if .Labels.name}}
<b>--> Server: {{.Labels.name}}</b>
{{else if .Labels.instance}}
<b>--> Server: {{.Labels.instance}}</b>
{{else if .Labels.proxy}}
<b>--> Ha backend: {{.Labels.proxy}}</b>
{{else if .Labels.server}}
<b>--> Server: {{.Labels.server}}</b>
{{else -}}
<b>--> Server: Unknown</b>
{{end}}
 Problem: {{.Labels.alertname}}
{{end}}

AlertList: http://pmm.alfaexploit.com/prometheus/alerts
AlertSilence: http://pmm.alfaexploit.com:9093/#/alerts
We build the image:
We check that it exists:
REPOSITORY           TAG                 IMAGE ID            CREATED             SIZE
prometheus_bot       latest              50046b0f988e        5 seconds ago       23.1MB
We start the image but do not expose the port to the outside world since only pmm-server will access it through Docker’s internal network:
We check that it has started:
CONTAINER ID        IMAGE                  COMMAND                  CREATED             STATUS                            PORTS                                      NAMES
b10cf1280f04        prometheus_bot             "prometheus_bot"   3 minutes ago       Restarting (127) 39 seconds ago                                              pmm-telegrambot
If we make changes to the template or configuration, we must delete the old container, regenerate the image, and relaunch it:
docker stop pmm-telegrambot
docker rm pmm-telegrambot
docker image rm prometheus_bot
docker build -t prometheus_bot .
docker run -d --network=pmm-net --name pmm-telegrambot --restart always prometheus_bot:latest
If we look at the container logs, we will see the fields of the received alert. With these fields, we can create the bot template with the information we need:
2020/04/16 14:32:17 Bot alert post: CHATID
2020/04/16 14:32:17 +------------------ A L E R T J S O N -------------------+
2020/04/16 14:32:17 {"alerts":[{"annotations":{},"endsAt":"0001-01-01T00:00:00Z","generatorURL":"http://localhost:9090/prometheus/graph?g0.expr=redis_up+%3D%3D+0\u0026g0.tab=1","labels":{"alertname":"RedisDown","instance":"kr0mtest:9121","job":"redis_exporter","node_name":"kr0mtest:9121","severity":"critical"},"startsAt":"2020-04-16T14:31:47.086Z"}],"commonAnnotations":{},"commonLabels":{"alertname":"RedisDown","instance":"kr0mtest:9121","job":"redis_exporter","node_name":"kr0mtest:9121","severity":"critical"},"externalURL":"http://4eb9bbb54554:9093","groupKey":0,"groupLabels":{},"receiver":"telegram","status":"firing","version":0}
2020/04/16 14:32:17 +-----------------------------------------------------------+

2020/04/16 14:32:17 +--------------- F I N A L M E S S A G E ---------------+
2020/04/16 14:32:17
Status: <b>FIRING 🔥</b>

<b>Active Alert List:</b>
<b>--> Server: kr0mtest:9121</b>
 Problem: RedisDown

AlertList: http://pmm.alfaexploit.com/prometheus/alerts
AlertSilence: http://pmm.alfaexploit.com:9093/#/alerts

2020/04/16 14:32:17 +-----------------------------------------------------------+
[GIN] 2020/04/16 - 14:32:17 | 200 | 82.008708ms | 172.18.0.2 | POST "/alert/CHATID"
We can use this template as a reference:
https://github.com/inCaller/prometheus_bot/blob/master/testdata/production_example.tmpl
DEBUG
We can see the CT logs with:
If the CT does not start with the entrypoint indicated in the Dockerfile, we will not be able to access it, so we start it with a loop and access it to take a look and make sure everything is in order:
docker rm pmm-telegrambot
docker run -d –network=pmm-net –name pmm-telegrambot –restart always prometheus_bot:latest /bin/sh -c “while true; do sleep 2; done”
docker exec -it pmm-telegrambot sh
-rw-r--r-- 1 root root 184 Mar 31 14:06 /config.yaml
-rwxr-xr-x 1 root root 15580478 Mar 31 14:06 /prometheus_bot
-rw-r--r-- 1 root root 396 Mar 31 14:06 /template.tmpl
Now we install and configure Alertmanager, which will use the Telegram bot and a webhook to an API on an Asterisk server, so it will send us a Telegram message and call us on the phone.
NOTE: The biggest drawback of Alertmanager is that it works by polling, not by events, so neither alarms nor recoveries will be instantaneous.
To get the chatid of the Telegram group, we add a bot to the group:
@RawDataBot
Once we have obtained the necessary information, we delete it.
We perform the Alertmanager configuration in an external file, so we can reinstall the CT without losing the work done.
global:

route:

  # Default receiver por defecto: Alertmanager parece ignorar este parámetros, como lo ignora lo definimos mas abajo como un receiver vacío
  receiver: 'default'

  # No agrupes las alertas, de este modo los resolved se ven claros en Telegram
  #group_by: [node_name]

  # Tiempo de espera desde que se recibe por primera vez la alerta de grupo hasta que se envia(solo aplicable si se agrupan alertas)
  #group_wait: 30s

  # Tiempo de espera entre notificaciones de una alarma de grupo previamente recibida(solo aplicable si se agrupan alertas)
  #group_interval: 6m

  # Cada cuanto reenviar las alertas, a esto hay que sumarle el tiempo del alert de Prometheus
  # Si el alert tiene "for: 6m" y repeat_interval 1m -> la alerta se enviará cada 6+1=7m
  repeat_interval: 1m

  # Additional receivers
  routes:

  # Telegram: Solo alarmas criticas
  - match:
      severity: critical
    receiver: 'telegram'
    continue: true

  # Asterisk: Solo alarmas criticas
  - match:
      severity: critical
    receiver: 'asterisk-api'
    continue: true

inhibit_rules:
- source_match:
    alertname: 'BrokenNodeExporter'
  target_match_re:
    severity: '.*'
  equal: ['node_name']

receivers:
- name: 'default'

- name: 'telegram'
  webhook_configs:
  - url: http://pmm-telegrambot:9087/alert/CHATID
    send_resolved: true

- name: 'asterisk-api'
  webhook_configs:
  - url: http://pmm-asterisk.alfaexploit.com:4444/alertSysAdmins
    send_resolved: false
NOTE: The inhibition of alerts will allow us to eliminate garbage alerts since if a server goes down, it is normal for all its exporters to fail. The inhibition rule indicates that the alert should be ignored regardless of severity if the node_name matches another BrokenNodeExporter alert. There are some alerts that cannot be inhibited, such as the fall of a node in a Mongo RS, since the ones that report the fall are the rest of the nodes in the RS, so the node_name is that of these servers and not that of the fallen server.
We do not expose the Alertmanager port to the outside because it does not have authentication. Instead, we will leave it on the internal Docker network and mount an Nginx with authentication that we will expose:
The Nginx configuration will be read from outside the CT:
server {
    listen 80;
    listen [::]:80;
    server_name pmm.alfaexploit.com;

    location / {
        auth_basic "Restricted Content";
        auth_basic_user_file /etc/nginx/.htpasswd;
        proxy_pass http://pmm-alertmanager:9093;
    }
}
We generate the password file, which will also be read from outside Nginx:
htpasswd -c prometheusConf/nginxAlertmanager/.htpasswd admin
We start the service:
We check that it has started:
fc4aa86409a3 nginx "nginx -g 'daemon of..." 22 seconds ago Up 20 seconds 0.0.0.0:9093->80/tcp pmm-alertmanager-nginx
If we want to see the alarms, we access Alertmanager:
http://pmm.alfaexploit.com:9093/#/alerts
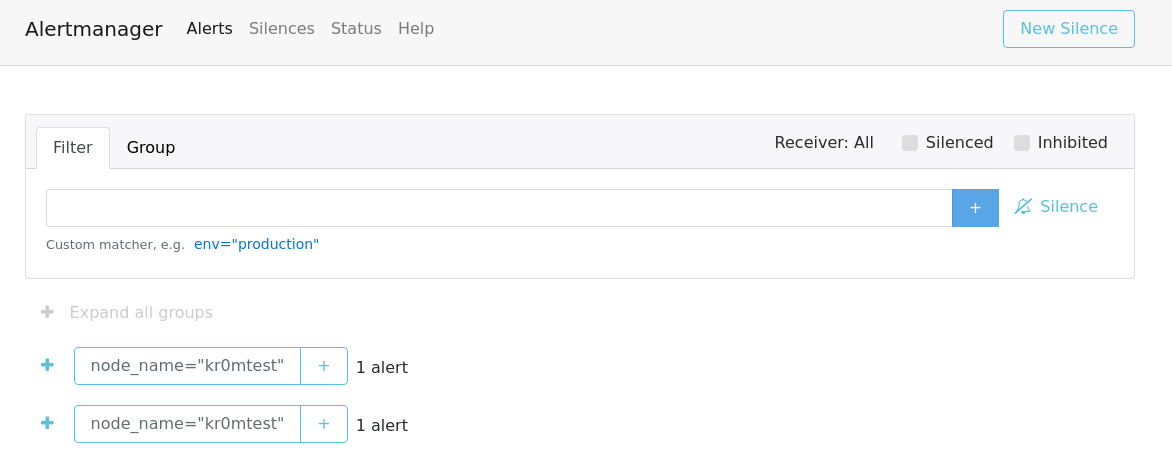
As you can see, the alerts appear duplicated. This is because the alert matches two receivers. If there were three receivers that matched, it would appear tripled. This is a bug in Alertmanager, and there is little we can do about it.
From this interface, we can silence alarms if it is the same duplicated alarm due to the match of the receivers. Silencing any of them will make the others disappear. One thing to keep in mind is that if we silence an alarm and resolve the problem, the recovery will not be sent until the silence expires. We can wait for it to expire on its own or go to the web interface and manually expire it. This way, it will immediately send the recovery, which can be useful if there is a group of sysadmins waiting for the Telegram.
The “sources” links of the alarms shown in Alertmanager do not work because Prometheus should be started with the --web.external-url parameter, but PMM2 no longer allows editing the startup file:
head /etc/supervisord.d/prometheus.ini
; Managed by pmm-managed. DO NOT EDIT.
And the pmm-managed service does not allow the --web.external-url parameter, if we try it, Prometheus does not start.
[program:pmm-managed]
priority = 14
command =
    /usr/sbin/pmm-managed
        --prometheus-config=/etc/prometheus.yml
        --prometheus-url=http://127.0.0.1:9090/prometheus
        --postgres-name=pmm-managed
        --postgres-username=pmm-managed
        --postgres-password=pmm-managed
        --supervisord-config-dir=/etc/supervisord.d
        --web.external-url=http://pmm.alfaexploit.com/prometheus/
2020-04-16 19:22:14,688 INFO exited: pmm-managed (exit status 1; not expected)
So that functionality will not work if we use PMM.
The alarms received on Telegram will look like this:
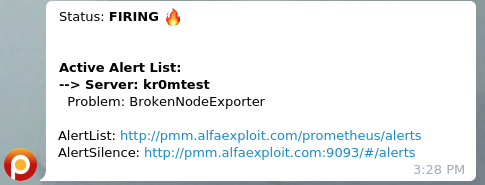
DEBUG
We can see the CT logs with:
To speed up the Alertmanager configuration, alerts can be generated manually. Below is a script developed from the traffic sniffed using Ngrep.
import json
import requests
import base64
import datetime

username = 'admin'
password = 'PASSWORD'

credentials = (username + ':' + password).encode('utf-8')
base64_encoded_credentials = base64.b64encode(credentials).decode('utf-8')

headers = {
    'Authorization': 'Basic ' + base64_encoded_credentials,
    'content-type': 'application/json'
}

startsAt = datetime.datetime.now().strftime("%Y-%m-%dT%H:%M:%S.000Z")
endsAt = (datetime.datetime.now() + datetime.timedelta(minutes=20)).strftime("%Y-%m-%dT%H:%M:%S.000Z")

data = [{"endsAt":endsAt,"startsAt":startsAt,"generatorURL":"http://localhost:9090/prometheus/graph?g0.expr=sum+by%28node_name%29+%28up%7Bagent_type%3D%22node_exporter%22%7D+%3D%3D+0%29\u0026g0.tab=1","labels":{"alertname":"generateAlarmAlertManager","node_name":"generateAlarmAlertManagerNode","severity":"critical"}}]

data_json = json.dumps(data)
#print("Sending %s: " % data_json)
r = requests.post('http://pmm.alfaexploit.com:9093/api/v2/alerts', data=data_json, headers=headers)
print("Received code: %s" % r.status_code)
We can debug the traffic with:
If we want to delete the alarms, we can restart Alertmanager:
Or reinsert the same alarm but with an endsAt very close to the current time.
UPDATE
The following template may be more convenient to silence alarms directly with a link:
{{if eq .Status "firing"}}
Status: <b>{{.Status | str_UpperCase}} 🔥 </b>
{{end}}
{{if eq .Status "resolved"}}
Status: <b>{{.Status | str_UpperCase}} ✅ </b>
{{end}}

<b>Active Alert List:</b>
{{- range $val := .Alerts}}
-- label values --
{{ range $key,$val := .Labels -}}
    {{$key}} = <code>{{$val}}</code>
{{ end }}
-- label values --
{{if .Labels.node_name }}
- Server: {{.Labels.node_name}}
  Problem: {{.Labels.alertname}}
  Silence: http://pmm.alfaexploit.com:9093/#/silences/new?filter=%7Balertgroup%3D%22{{.Labels.alertgroup}}%22%2C%20alertname%3D%22{{.Labels.alertname}}%22%2C%20node_name%3D%22{{.Labels.node_name}}%22%2C%20severity%3D%22{{.Labels.severity}}%22%7D
{{else if .Labels.name}}
- Server: {{.Labels.name}}
  Problem: {{.Labels.alertname}}
  Silence: http://pmm.alfaexploit.com:9093/#/silences/new?filter=%7Balertgroup%3D%22{{.Labels.alertgroup}}%22%2C%20alertname%3D%22{{.Labels.alertname}}%22%2C%20node_name%3D%22{{.Labels.name}}%22%2C%20severity%3D%22{{.Labels.severity}}%22%7D
{{else if .Labels.instance}}
- Server: {{.Labels.instance}}
  Problem: {{.Labels.alertname}}
  Silence: http://pmm.alfaexploit.com:9093/#/silences/new?filter=%7Balertgroup%3D%22{{.Labels.alertgroup}}%22%2C%20alertname%3D%22{{.Labels.alertname}}%22%2C%20node_name%3D%22{{.Labels.instance}}%22%2C%20severity%3D%22{{.Labels.severity}}%22%7D
{{else if .Labels.proxy}}
- Ha backend: {{.Labels.proxy}}
  Problem: {{.Labels.alertname}}
  Silence: http://pmm.alfaexploit.com:9093/#/silences/new?filter=%7Balertgroup%3D%22{{.Labels.alertgroup}}%22%2C%20alertname%3D%22{{.Labels.alertname}}%22%2C%20node_name%3D%22{{.Labels.proxy}}%22%2C%20severity%3D%22{{.Labels.severity}}%22%7D
{{else if .Labels.server}}
- Server: {{.Labels.server}}
  Problem: {{.Labels.alertname}}
  Silence: http://pmm.alfaexploit.com:9093/#/silences/new?filter=%7Balertgroup%3D%22{{.Labels.alertgroup}}%22%2C%20alertname%3D%22{{.Labels.alertname}}%22%2C%20node_name%3D%22{{.Labels.server}}%22%2C%20severity%3D%22{{.Labels.severity}}%22%7D
{{else -}}
- Server: Unknown
  Problem: {{.Labels.alertname}}
{{end}}
{{end}}