Prometheus is a very flexible monitoring and alert software, it allows storing metrics in its database and performing queries on it, this combined with Grafana provides us with everything we need to monitor our server infrastructure.
In this article, I will explain quickly how to install the node_exporter on FreeBSD.
We install the node_exporter:
We start the service:
service node_exporter start
We configure the firewall rules so that the Prometheus server can access the server to be monitored:
# Allow Prometheus
$cmd 00710 allow tcp from PROMETHEUS_IP to me 9100 in via $wanif
$cmd 00710 allow tcp from me 9100 to PROMETHEUS_IP out via $wanif
We configure Prometheus to “scrape” the metrics:
- job_name: SERVERNAME
  scrape_interval: 1m
  scrape_timeout: 10s
  metrics_path: /metrics
  scheme: http
  static_configs:
  - targets:
    - SERVERIP:9100
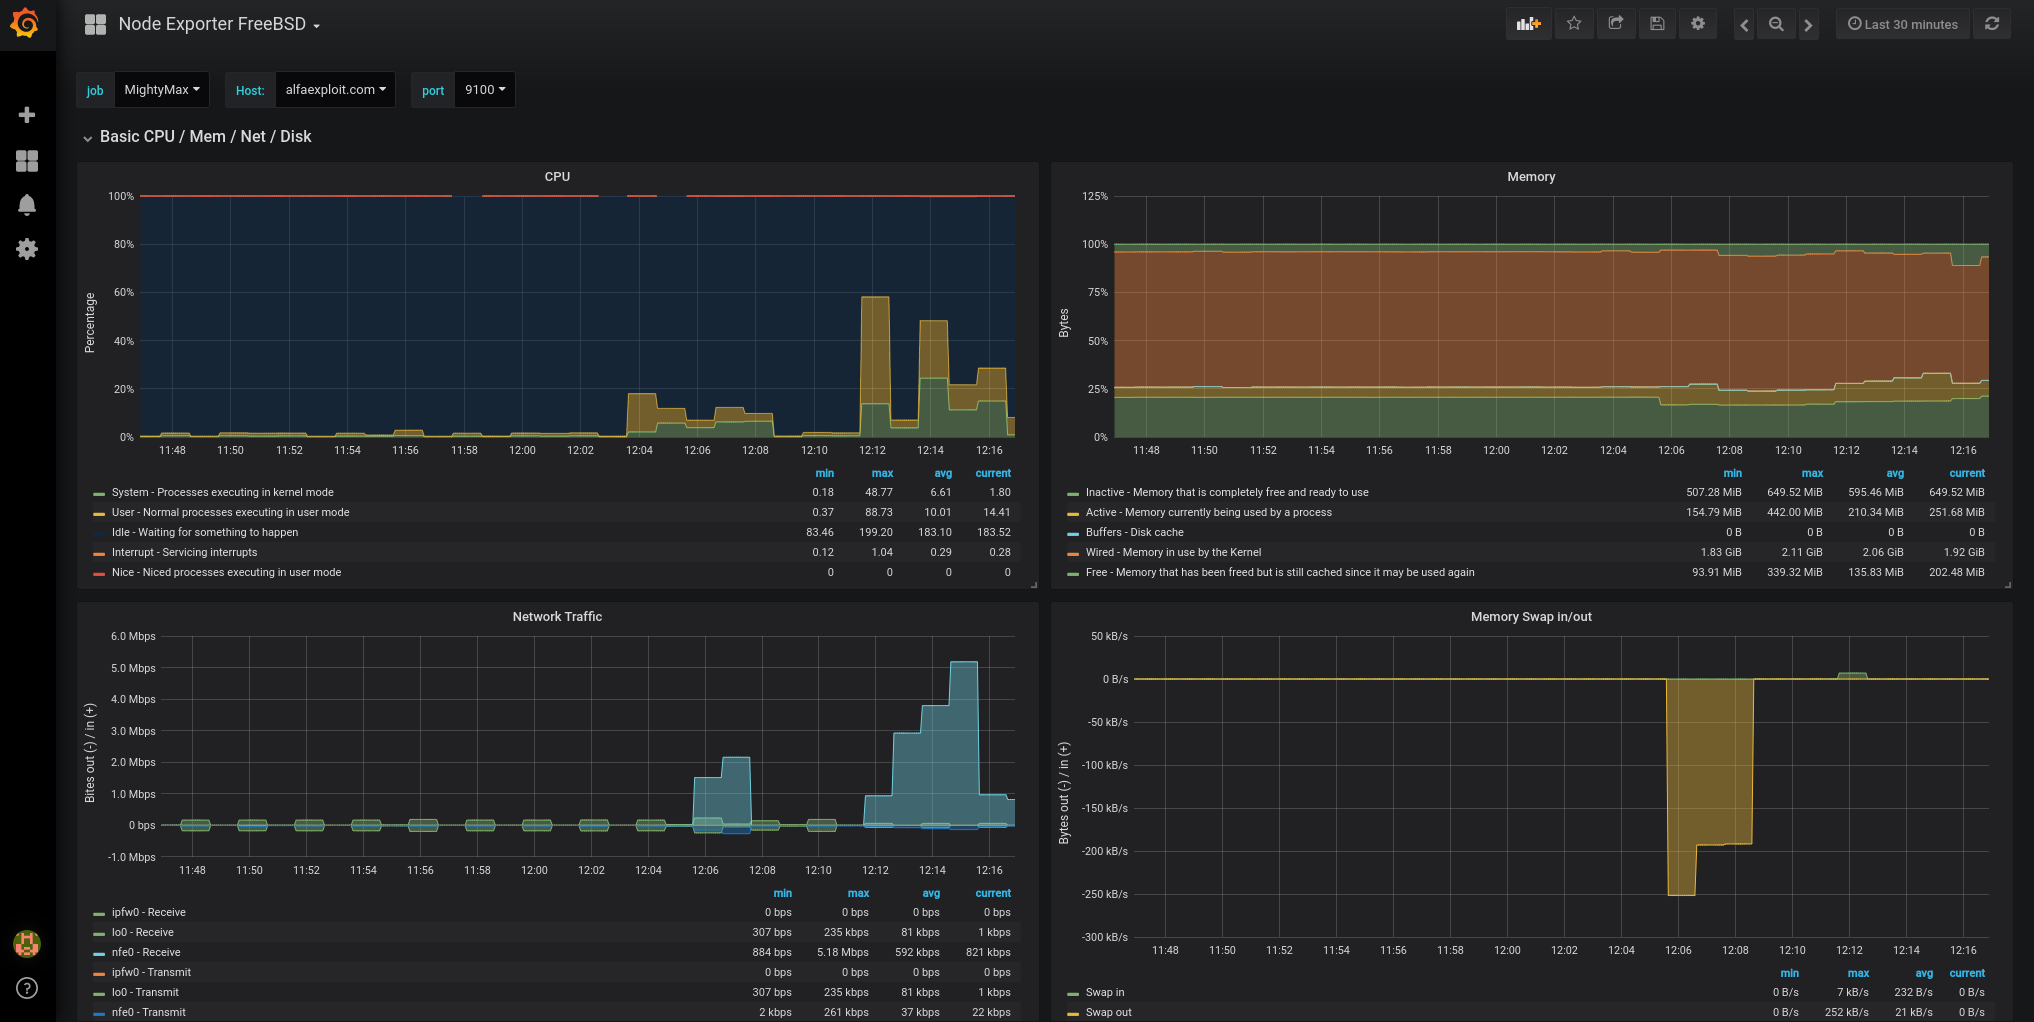
To visualize the obtained metrics, we will use Grafana, this dashboard for FreeBSD is quite complete:
https://grafana.com/grafana/dashboards/4260
In the dashboard, there are unnecessary items, so we remove them.
The final result is this: