Percona Monitoring and Management or PMM is a set of tools that will allow us to quickly and easily monitor our servers and especially databases. If we enable all the options, it will show us a lot of useful information about slow queries, locks, and other problems related to MySQL and MongoDB.
Metrics monitoring is done through Prometheus and their visualization through Grafana .
The entire installation will be done on Docker as it simplifies both the installation and future server updates.
We create a user-defined network to be able to use the CT names directly. When we restart CTs, the IP addresses will change but we will not have to touch the configuration thanks to having used our user-defined network. In a basic installation, this aspect is not important, but when we configure Alertmanager, it will be useful:
Updating to PMM2 does not allow the migration of old data, everything must be reinstalled from scratch.
PMM needs approximately 1GB of storage for each database to be monitored with a retention of one week. As for RAM, 2GB per database server are needed, but this requirement is not linear. For example, for 20 nodes, 16GB are needed, not 40.
Currently, PMM versioning works as follows:
- pmm-server:latest -> Indicates the latest release of the PMM 1.X branch
- pmm-server:2 -> Indicates the latest release of the PMM 2 branch
We download the PMM2 Docker image:
We create the CT where PMM data will be stored. This CT will not be running, it will only serve as a storage CT. In future updates, we will delete the PMM CT, but the data will persist between updates since it resides in this other CT.
We create the PMM CT and map the prometheus.base.yml file. This will allow us to perform a custom configuration of Prometheus. For now, we leave it empty, we just create it:
docker run -d -p 80:80 -p 443:443 -v $PWD/prometheusConf/prometheus.base.yml:/srv/prometheus/prometheus.base.yml --volumes-from pmm-data --dns 8.8.8.8 --dns-search=alfaexploit.com --network=pmm-net --name pmm-server --restart always percona/pmm-server:2
We access the PMM web interface:
http://PMM_IP
(admin/admin)
We change the password.
We perform the basic PMM configuration:
PMM -> PMM Settings
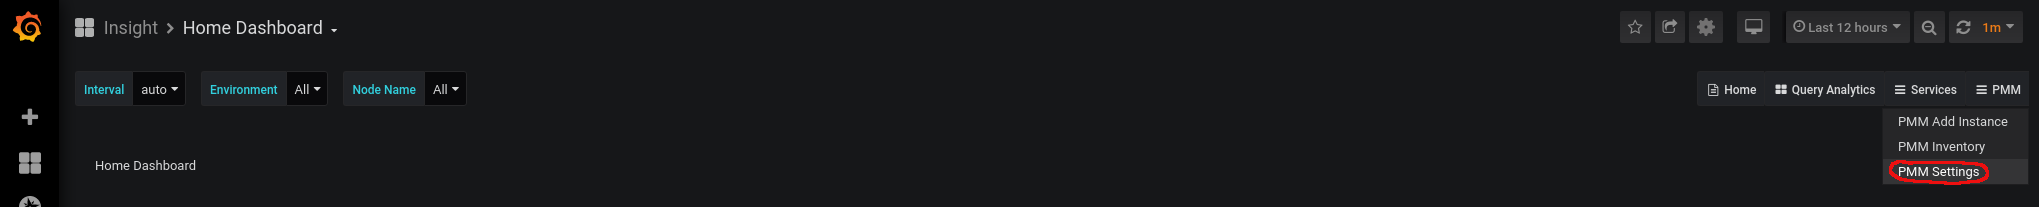
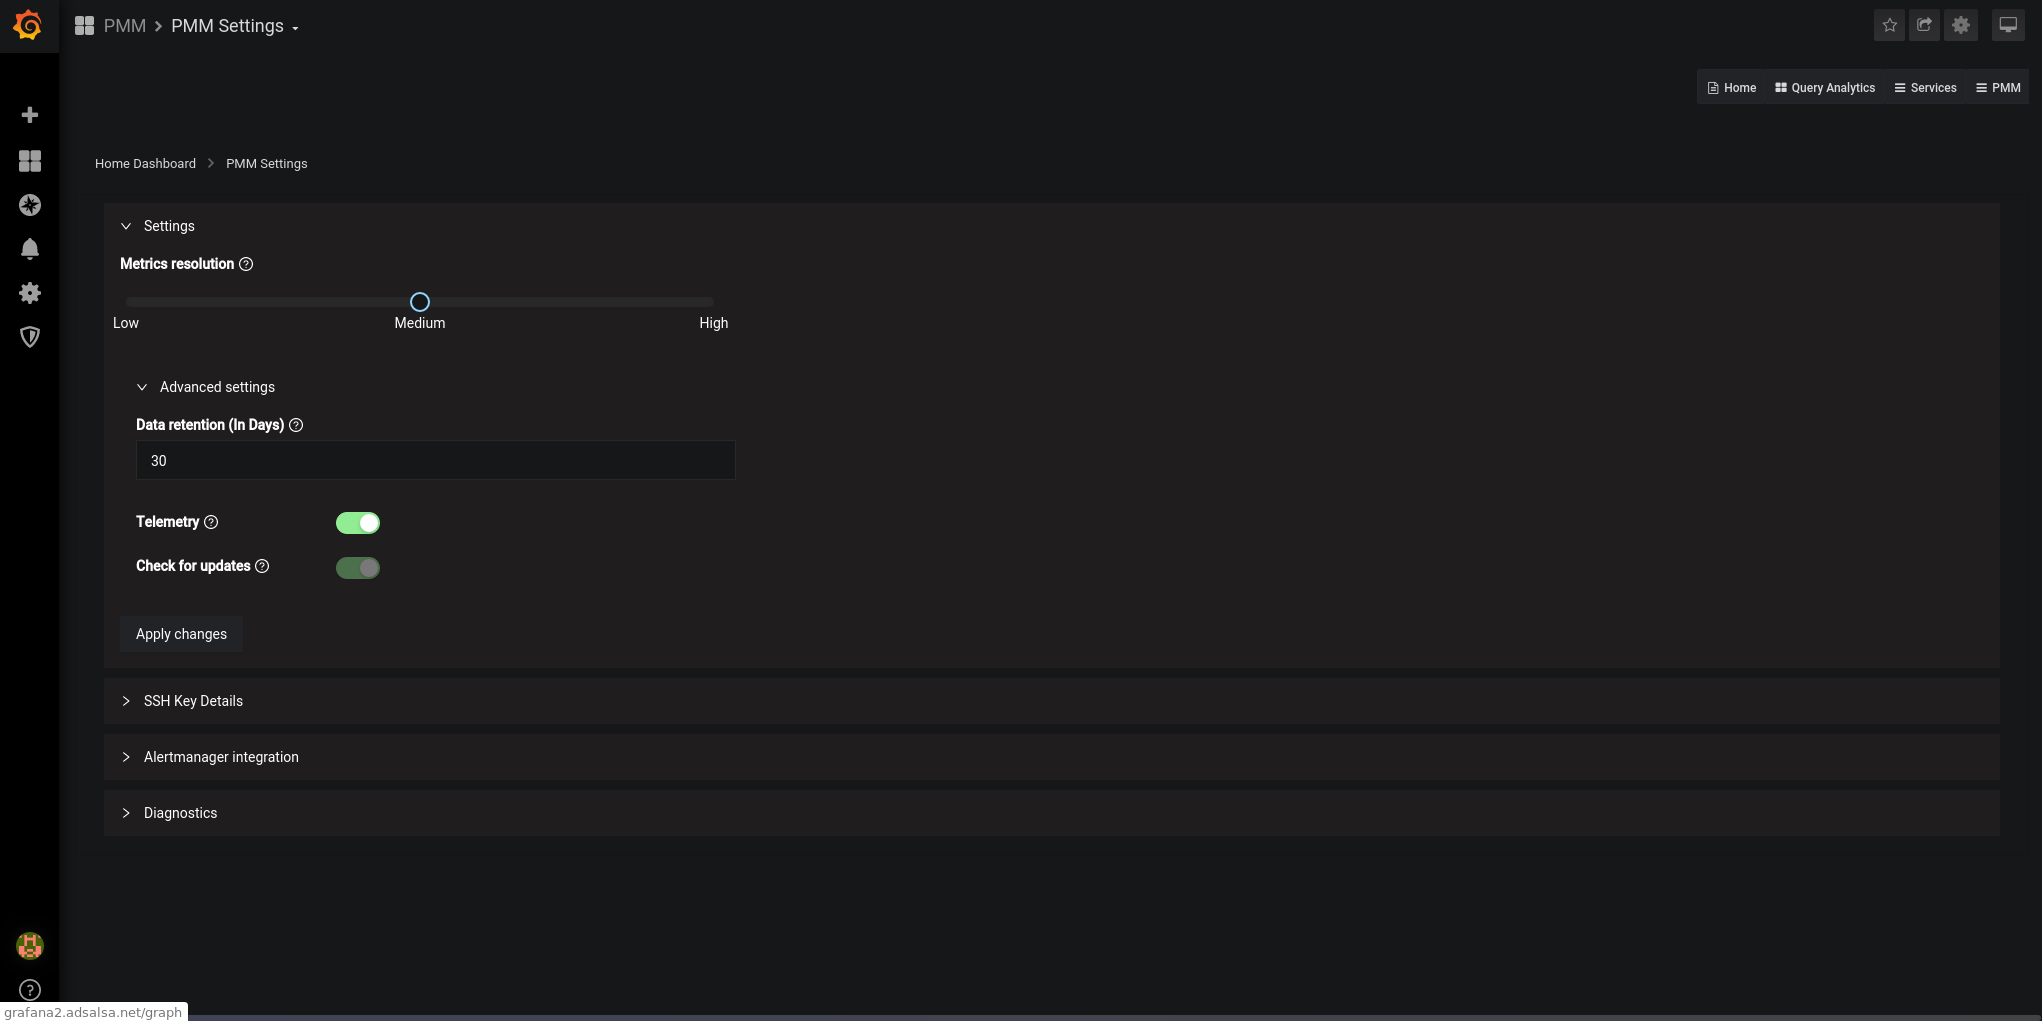
We adjust the parameters according to our needs:
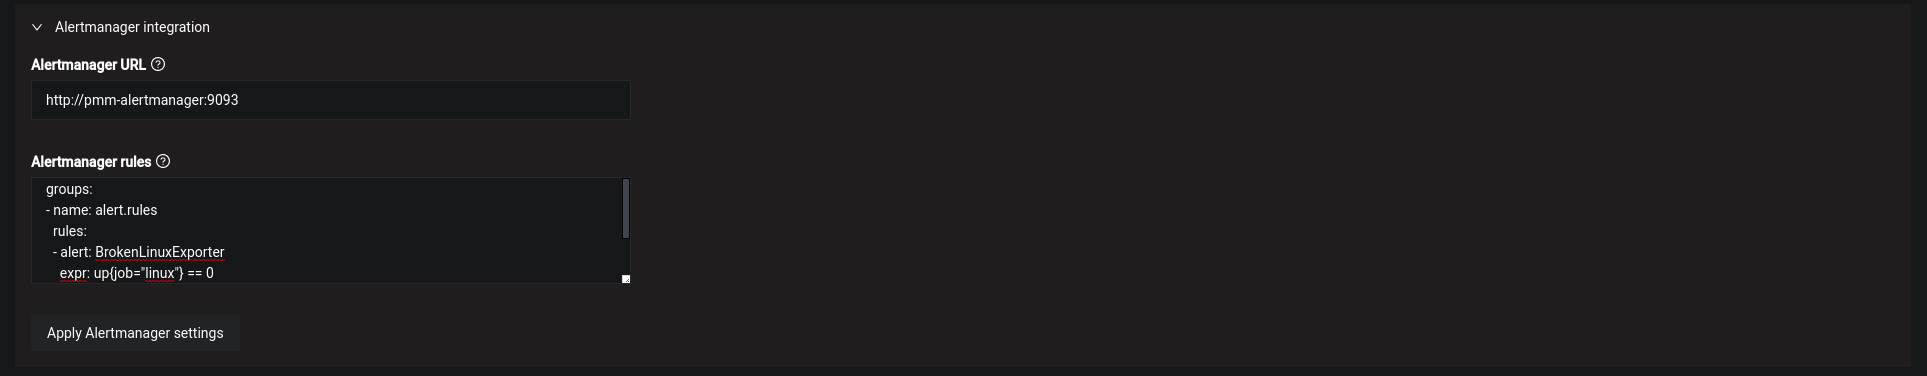
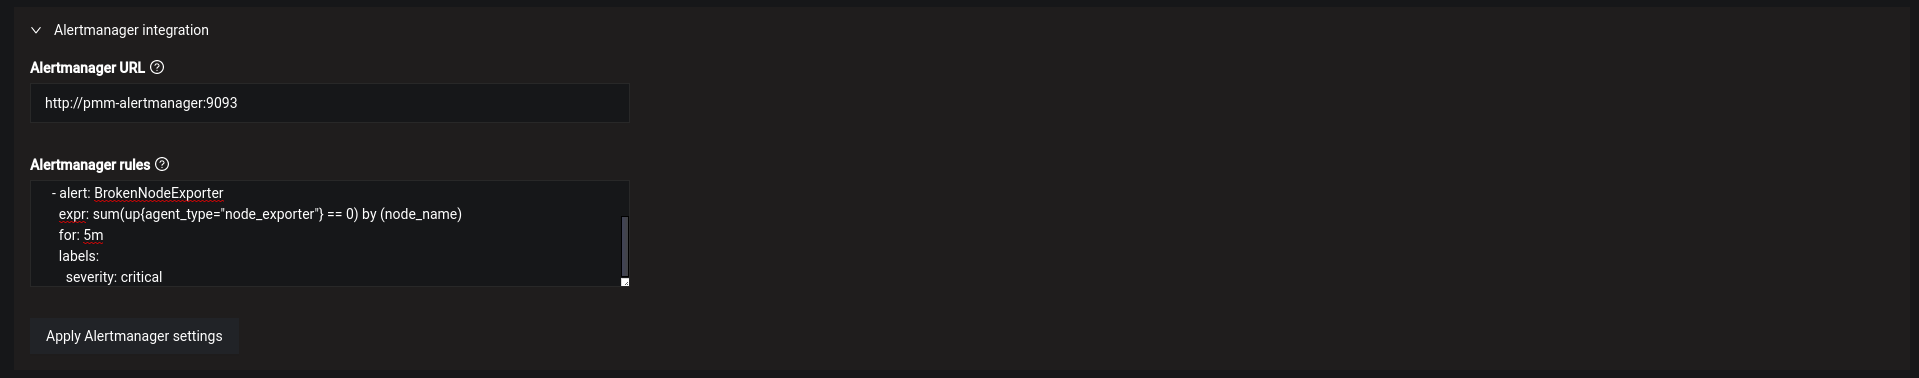
We configure the Alertmanager URL. In future articles, I will explain how to set it up. For now, we just configure it and paste the alert rules:
Alertmanager URL:
http://pmm-alertmanager:9093
Alertmanager rules:
groups:
- name: genericRules
  rules:
  - alert: BrokenNodeExporter
    expr: up{agent_type="node_exporter"} == 0
    for: 5m
    labels:
      severity: critical
We restart PMM:
NOTE: Restarting Prometheus is a heavy process. It takes quite a while (4m) for the web interface to be operational again.
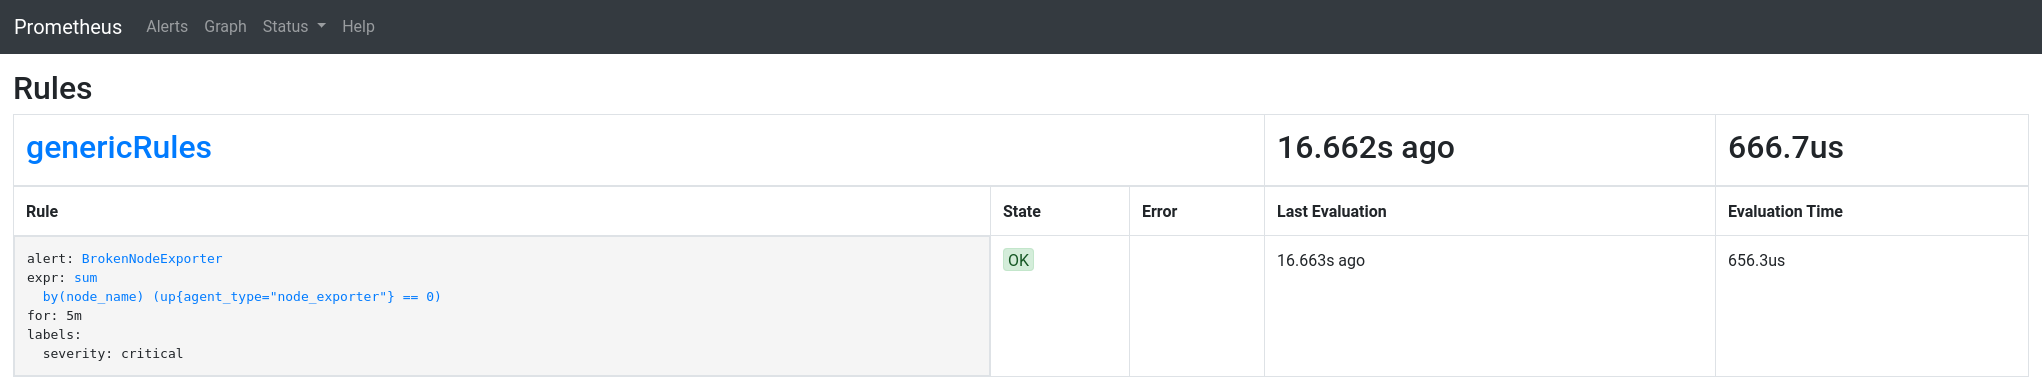
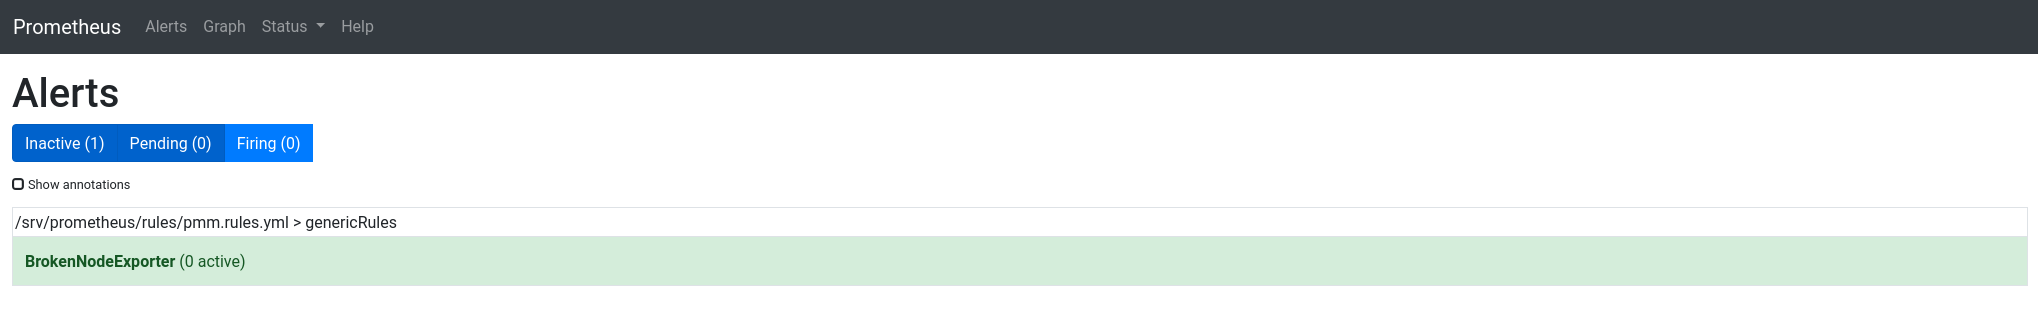
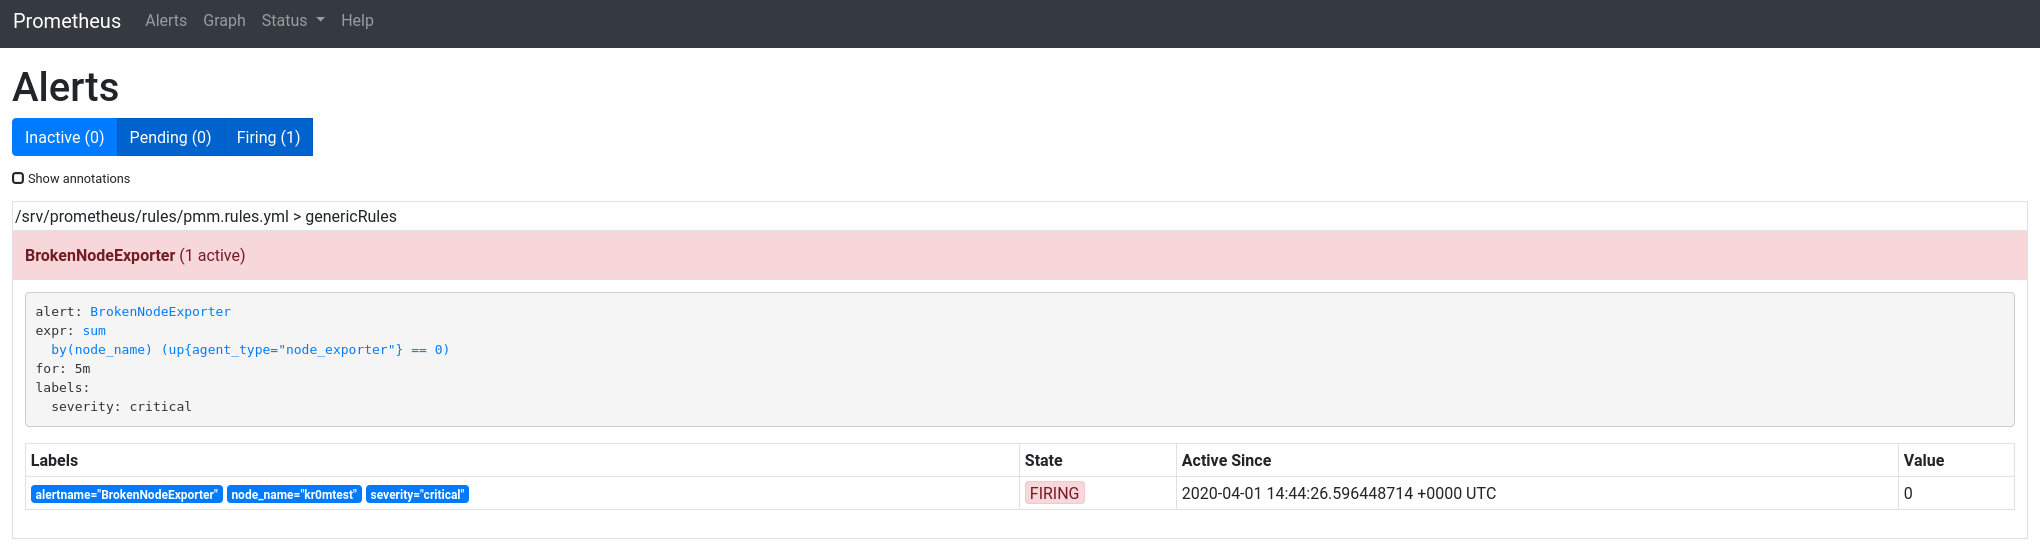
We check from the Prometheus interface that the rules are loaded:
Status -> Rules
In Alerts, we can see the list of alerts:
We can also check within the CT that the file contains the defined alarms:
rule_files:
- /srv/prometheus/rules/*.rules.yml
groups:
- name: genericRules
  rules:
  - alert: BrokenNodeExporter
    expr: up{agent_type="node_exporter"} == 0
    for: 5m
    labels:
      severity: critical
The client is installed as follows:
Ubuntu:
dpkg -i percona-release_latest.generic_all.deb
apt-get update
apt-get install pmm2-client
pmm-admin config --server-insecure-tls --server-url=https://admin:PASSWORD@PMM_SERVER:443
Gentoo:
tar xvzf pmm2-client-2.6.1.tar.gz
cd pmm2-client-2.6.1
./install_tarball
Add the installed binaries to the path:
Make the change permanent:
echo "PATH=$PATH:/usr/local/percona/pmm2/bin" » .bashrc
echo "export BASH_ENV=~/.bashrc" » .bash_profile
echo "if [ -f ~/.bashrc ]; then source ~/.bashrc; fi" » .bash_profile
To make the exporters work, we must first configure/start the agent:
If we set up incorrectly, the second time we run it, it will tell us:
Failed to register pmm-agent on PMM Server: Node with name "kr0mtest" already exists..
We will have to add the option: –force to the command.
Manually start the pmm-agent to check that it does not give any problems:
In another console, we can see the exporters:
Service type  Service name         Address and port  Service ID

Agent type                  Status     Agent ID                                        Service ID
pmm_agent                   Connected  /agent_id/aba88792-1544-420a-a091-cbffe93f9232
node_exporter               Running    /agent_id/d35f58b3-a4e8-4367-8659-d726adf3641a
Daemonize the agent:
chmod 700 /etc/local.d/pmm.start
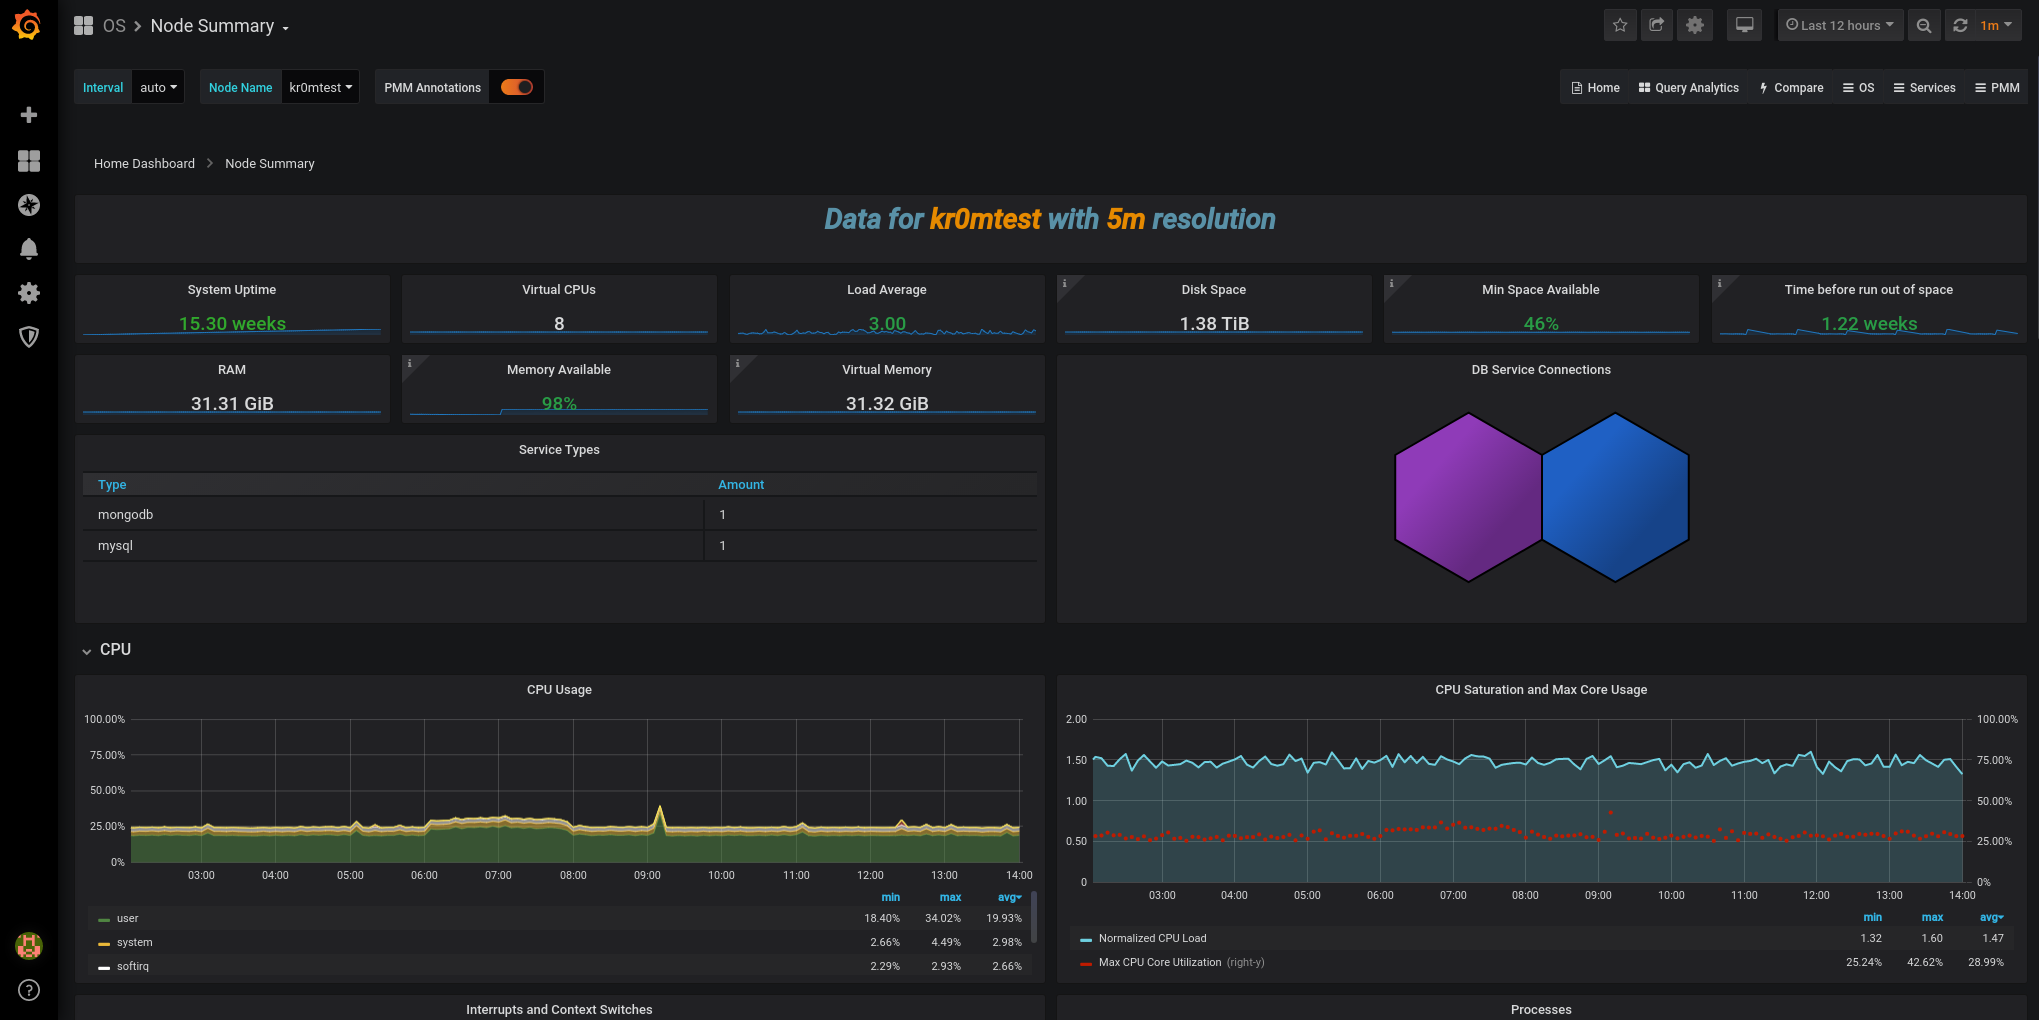
In the Grafana interface, we can now see data:
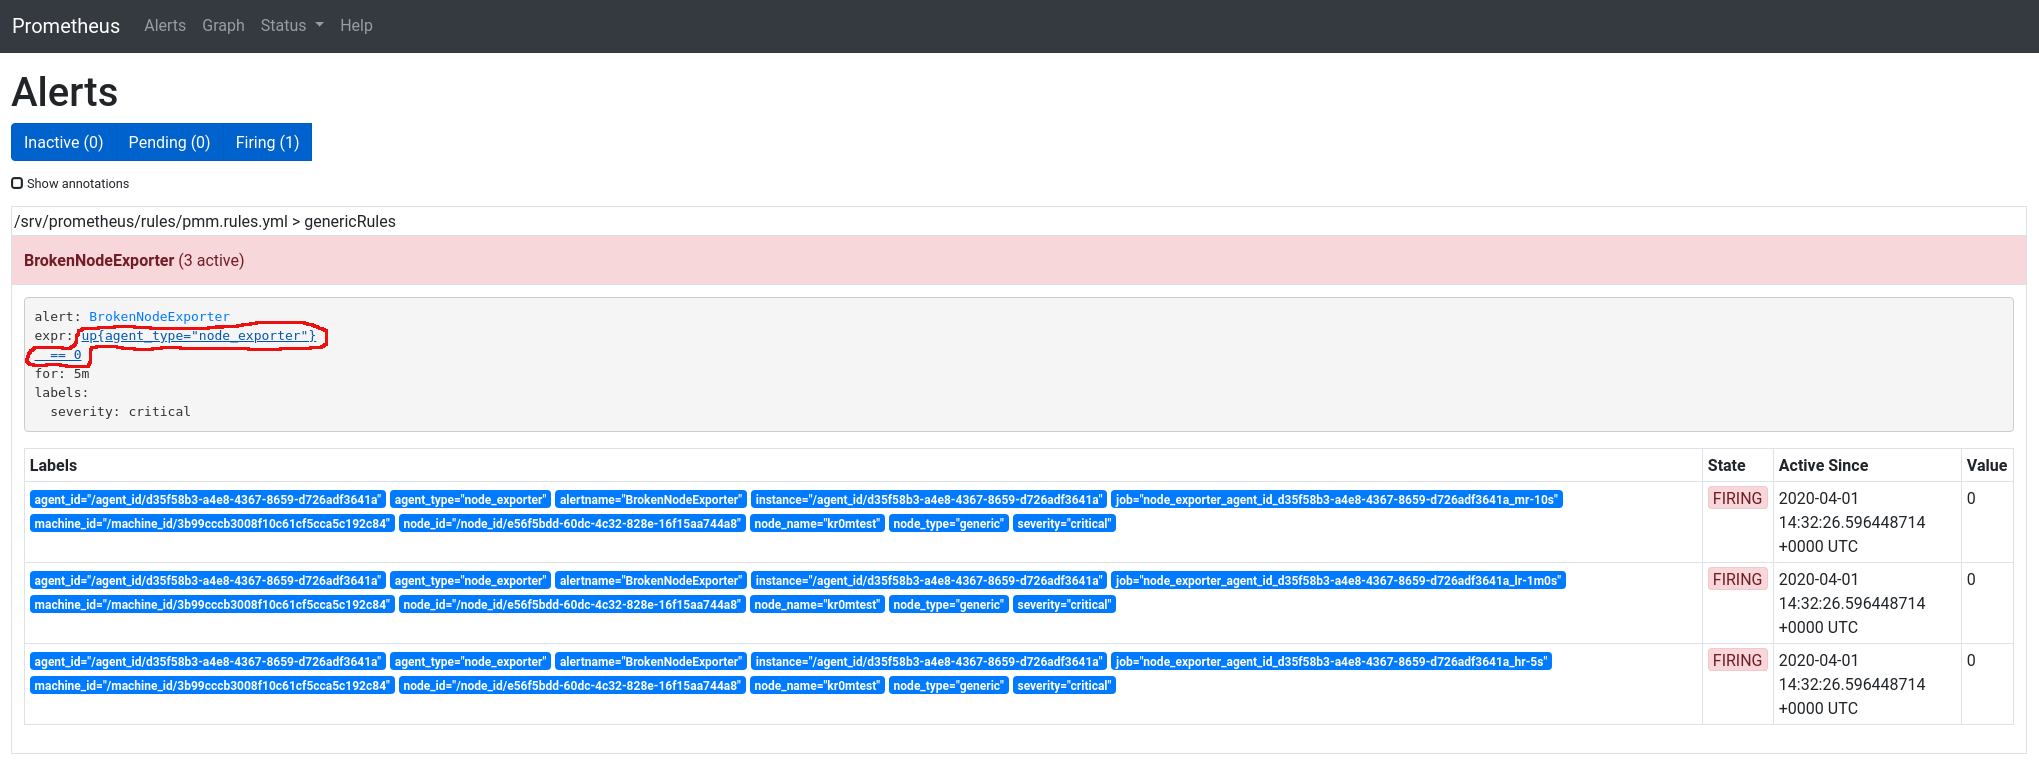
In PMM2, several things have changed compared to the previous version, one of them is that it performs several data collections (scraps) at different frequencies, the data that usually changes is collected more frequently and the more static data is collected less frequently, this presents a problem when an alarm goes off, it appears tripled:
job="node_exporter_agent_id_d35f58b3-a4e8-4367-8659-d726adf3641a_hr-5s"
job="node_exporter_agent_id_d35f58b3-a4e8-4367-8659-d726adf3641a_mr-10s"
job="node_exporter_agent_id_d35f58b3-a4e8-4367-8659-d726adf3641a_lr-1m0s"
We need to unify alarms when agent_id, agent_type, alertname, alertname, machine_id, node_id, node_id, node_name, node_type, and severity match.
In the screenshot, we can see the alarm is tripled. If we click on the expression link, it will take us to the query executor.
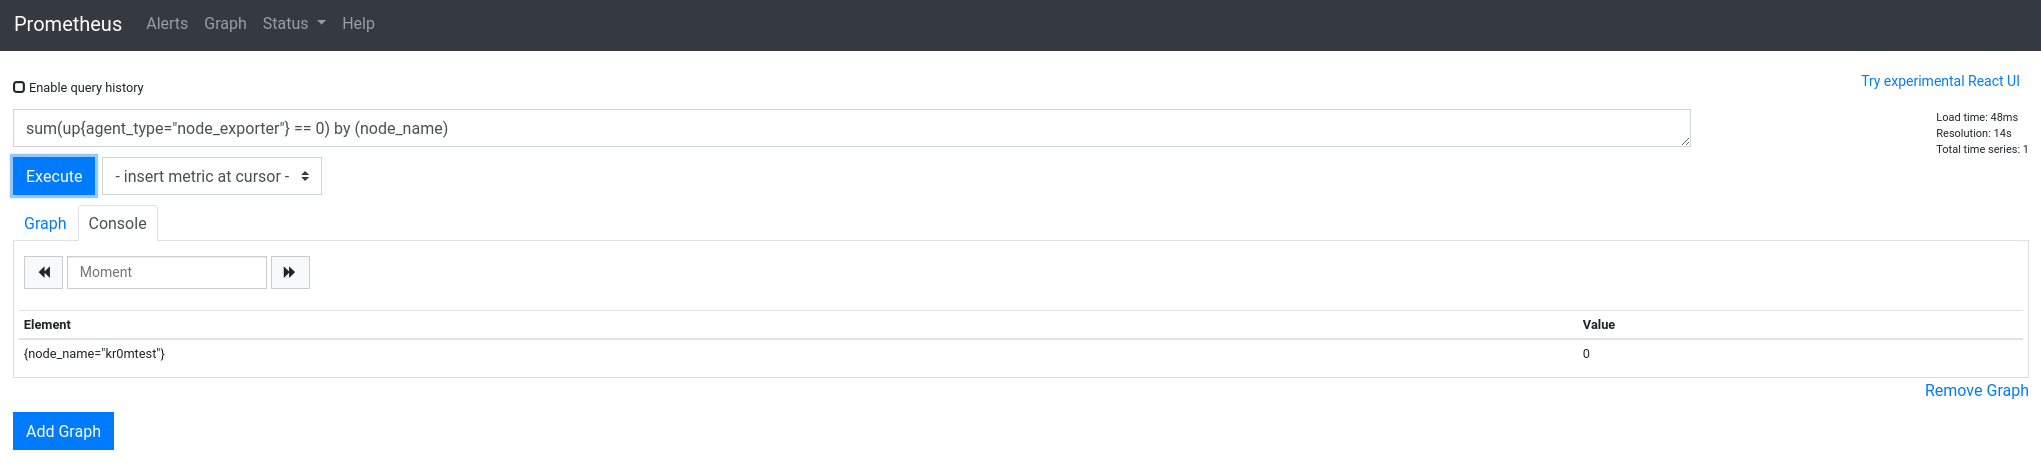
Here we can adapt the queries until they match the alerts we need. In this case, if we unify by node_name, it only shows one result:
sum(up{agent_type="node_exporter"} == 0) by (node_name)
We modify the alert configuration:
Alertmanager rules:
groups:
- name: genericRules
  rules:
  - alert: BrokenNodeExporter
    expr: sum(up{agent_type="node_exporter"} == 0) by (node_name)
    for: 5m
    labels:
      severity: critical
We restart PMM:
Now the alerts are unified:
TROUBLESHOOTING
View CT logs:
tail /srv/logs/pmm-managed.log
Useful CT information:
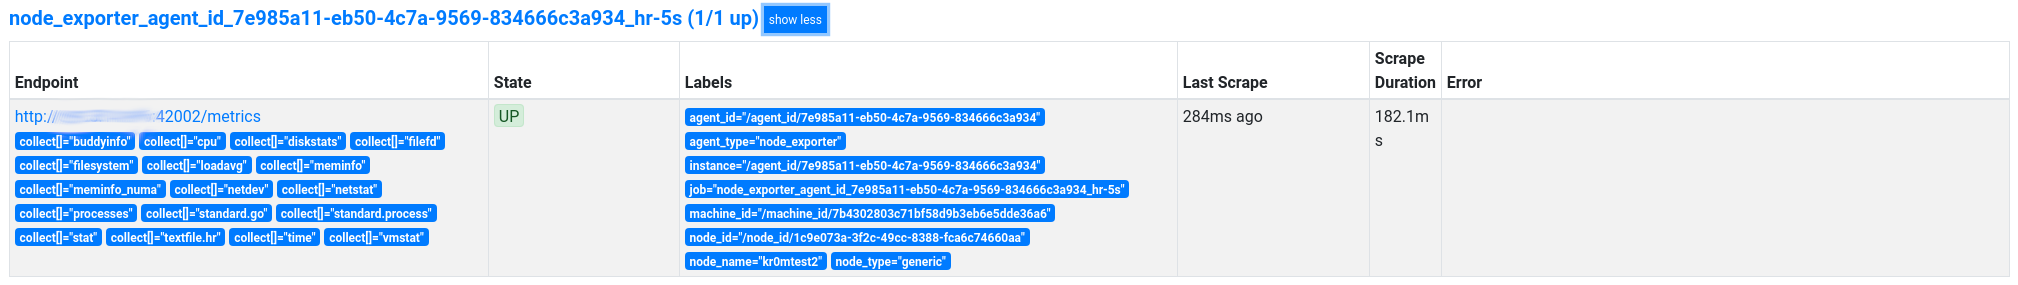
To check if we are correctly collecting a metric, we can consult it in the Prometheus interface, Status -> Targets, but it will ask for authentication. The user is always pmm, and the password is the exporter ID we are consulting.
We check the exporters on the server:
Service type  Service name         Address and port  Service ID

Agent type                  Status     Agent ID                                        Service ID
pmm_agent                   Connected  /agent_id/d94f4797-68df-4832-835f-e2b742f3a189
node_exporter               Running    /agent_id/7e985a11-eb50-4c7a-9569-834666c3a934
In this case, there is only one, and its password is: /agent_id/7e985a11-eb50-4c7a-9569-834666c3a934
We can also consult it in the Prometheus web interface in the agent_id tag:
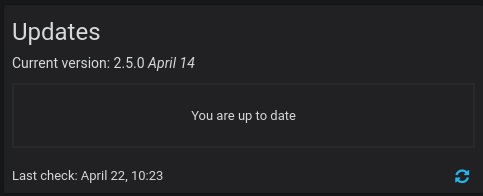
UPDATE
We check the current PMM version:
We stop the current PMM and rename the CT:
docker rename pmm-server pmm-server-backup
We download the latest version of PMM:
We start the new PMM reusing the data storage CT, so there is no loss of metrics between updates:
We check that the correct version is running:
curl -k -u admin:PASSWORD -X POST “https://PMM_SERVER/v1/Updates/Check” | jq
We remove the backup:
It can also be updated from the web interface (runs an Ansible playbook), but if the version is buggy, there will be no turning back:
http://PMMSERVER/graph/d/pmm-home/home-dashboard
We can read the release notes for the versions here .
NOTE: In case of a total reinstallation of the parent (Docker server), it will be necessary to backup any file that we import into the CT and the data CT.