The Nginx VTS (Virtual Host Traffic Status) module allows us to view Nginx statistics by vhost, which are very interesting for detecting possible performance problems or predicting future hardware expansions. This article explains how to configure VTS and the exporter so that Prometheus can read this information.
Nginx monitoring using Prometheus can be done using different exporters:
- Lua libraries in Nginx that execute a metrics logging script on each received request, which is a performance killer and does not work (the script runs with errors).
- Changing the Nginx log format to save response times in the logs and then parse them using mtail, which also does not work (it only extracts the metrics from the stat, not from mtail).
- Enabling Nginx stats and starting an exporter that reads the status and exports the data in metric form, which provides too basic information.
- Enabling Nginx VTS and starting an exporter that reads the VTS and exports the data in metric form.
On the Prometheus website, we can find the links to two exporters, the Lua library and the VTS . We will use VTS as it is the option that best suits my needs.
To enable the exporter to read the data, Nginx must be compiled with the VTS module . According to the module programmer:
This is similar to the live activity monitoring of nginx plus
We download the source code and recompile Nginx indicating where to find additional modules:
git clone git://github.com/vozlt/nginx-module-vts.git
echo ‘NGINX_ADD_MODULES="/usr/src/nginx-module-vts"’ » /etc/portage/make.conf
emerge -av www-servers/nginx
In the configure that emerge executes, we can see:
configuring additional modules
adding module in /usr/src/nginx-module-vts
 + ngx_http_vhost_traffic_status_module was configured
We verify that the compiled Nginx actually supports VTS:
vts
We configure Nginx to only allow access to statistics from localhost since only the local exporter should access them:
http {
        ...
        vhost_traffic_status_zone;
        server {
            listen 80;
            server_name _;

            access_log /var/log/nginx/localhost.access_log main;
            error_log /var/log/nginx/localhost.error_log info;

            root /var/www/localhost/htdocs;

            location /status {
                allow 127.0.0.1;
                deny all;
                vhost_traffic_status_display;
                vhost_traffic_status_display_format html;
            }
        }
        ...
}
We create a basic docroot to do the tests:
vi /var/www/localhost/htdocs/index.html
<html>
<header><title>This is title</title></header>
<body>
kr0mtest
</body>
</html>
We restart the service:
We check that we can access the status locally:
We compile and install the exporter:
echo “app-metrics/nginx-vts-exporter ~amd64” > /etc/portage/package.accept_keywords/nginx-vts-exporter
emerge -av app-metrics/nginx-vts-exporter
We start the exporter:
rc-update add nginx-vts-exporter default
We check that the exporter is listening and outputting the metrics:
tcp6 0 0 :::9913 :::* LISTEN 30387/nginx-vts-exp
We filter access to the exporter since we are going to put an authentication layer in front of it using Nginx:
/etc/init.d/iptables save
rc-update add iptables default
Now the curl should fail:
curl: (28) Failed to connect to SERVER_IP port 9913: Operation timed out
We add authentication, if the request comes from the PMM server we don’t ask for credentials:
http {
        ...
        vhost_traffic_status_zone;
        server {
            listen 80;
            server_name _;

            access_log /var/log/nginx/localhost.access_log main;
            error_log /var/log/nginx/localhost.error_log info;

            root /var/www/localhost/htdocs;

            location /status {
                allow 127.0.0.1;
                deny all;
                vhost_traffic_status_display;
                vhost_traffic_status_display_format html;
            }
        }
        server {
            listen 9914;
            server_name _;
            location /metrics {
                satisfy any;
                allow  PMM_SERVER_IP/32;
                auth_basic "Restricted Content";
                auth_basic_user_file /etc/nginx/.htpasswd;
                deny   all;

                proxy_pass http://127.0.0.1:9913;
            }
        }
        ...
}
We restart the service:
We generate the password file:
htpasswd -c /etc/nginx/.htpasswd admin
We check the metrics again, but this time through Nginx and using the credentials:
The process of accessing the metrics follows this logic:
- Port 9914 protected by auth through Nginx -> proxy_pass localhost:9913
- Port 9913 filtered by Iptables so that it can only be accessed from localhost -> /stats
- /stats filtered by Nginx so that it can only be accessed from localhost
The Prometheus configuration would be this:
scrape_configs:
- job_name: nginxExporter
  scrape_interval: 1m
  scrape_timeout: 10s
  metrics_path: /metrics
  scheme: http
  static_configs:
  - targets:
    - kr0mtest3:9914
    - kr0mtest4:9914
We can see the exporter in targets:

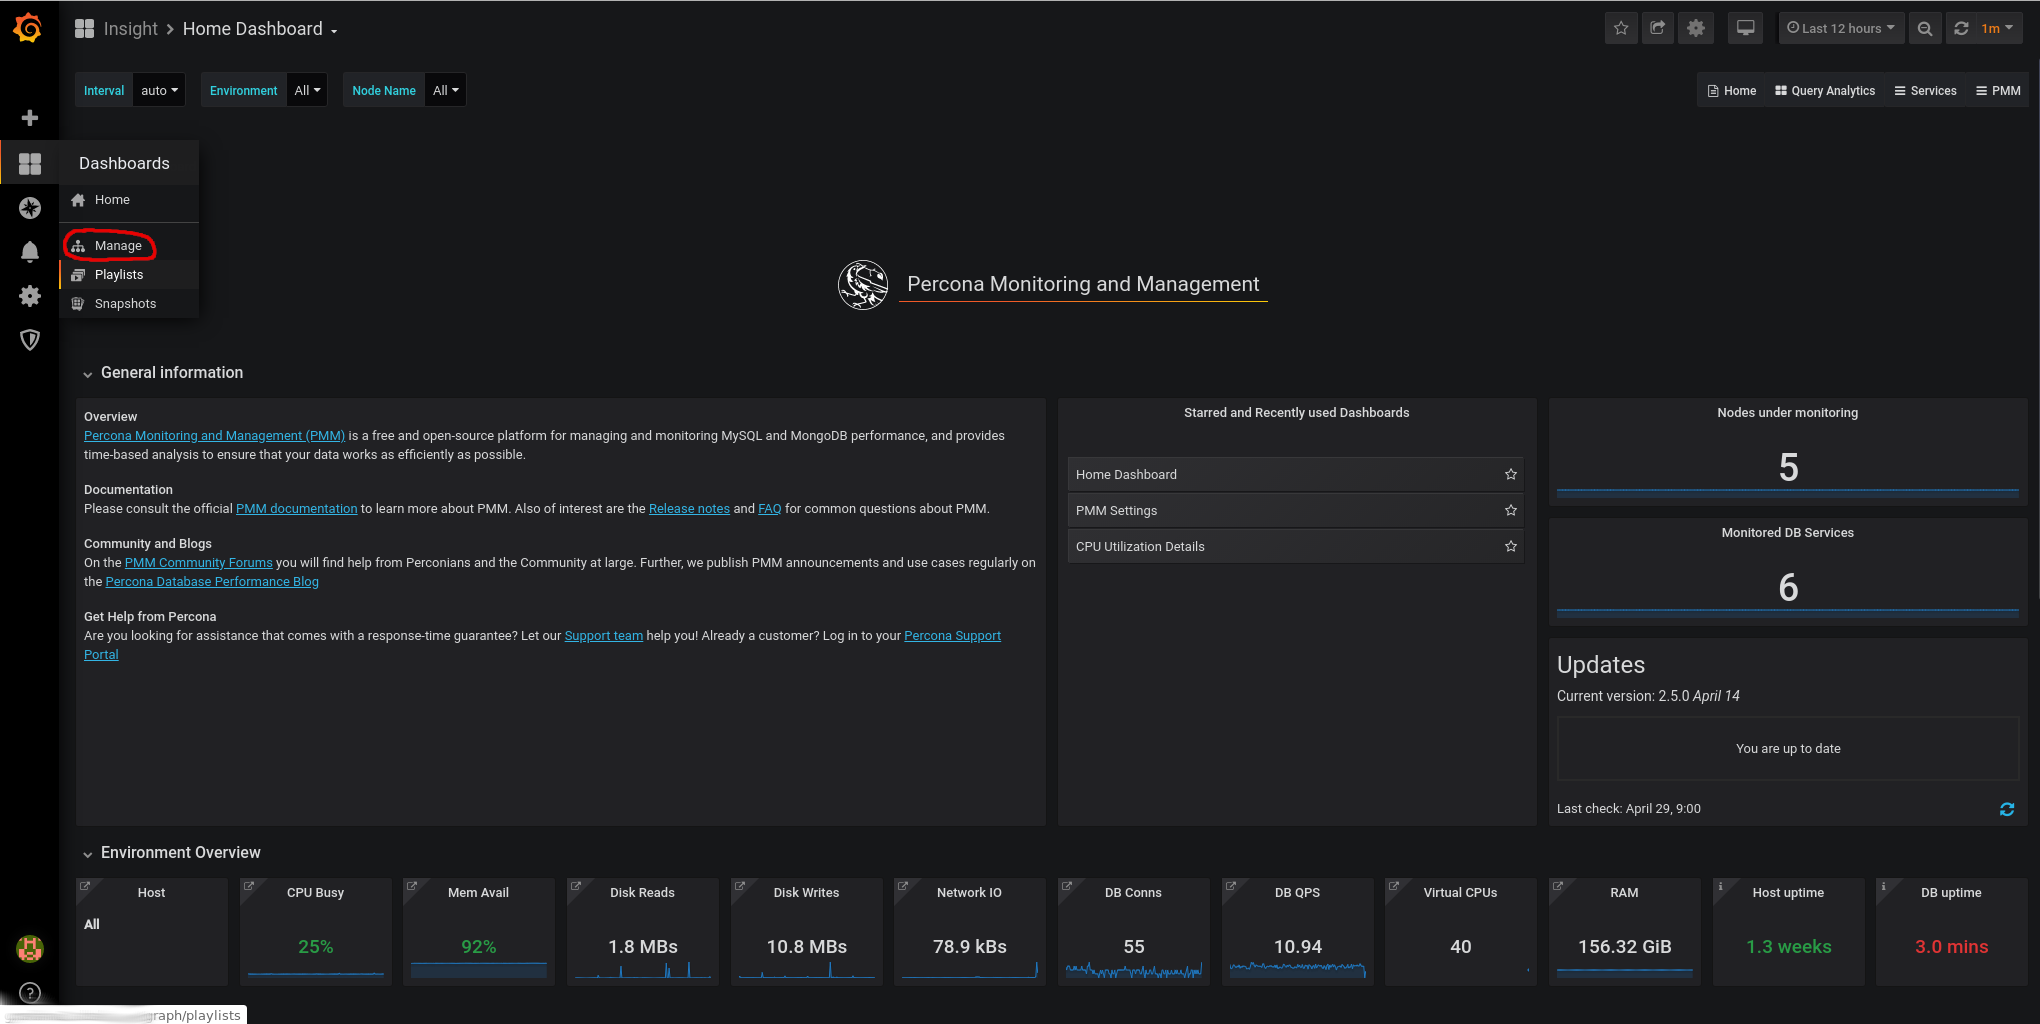
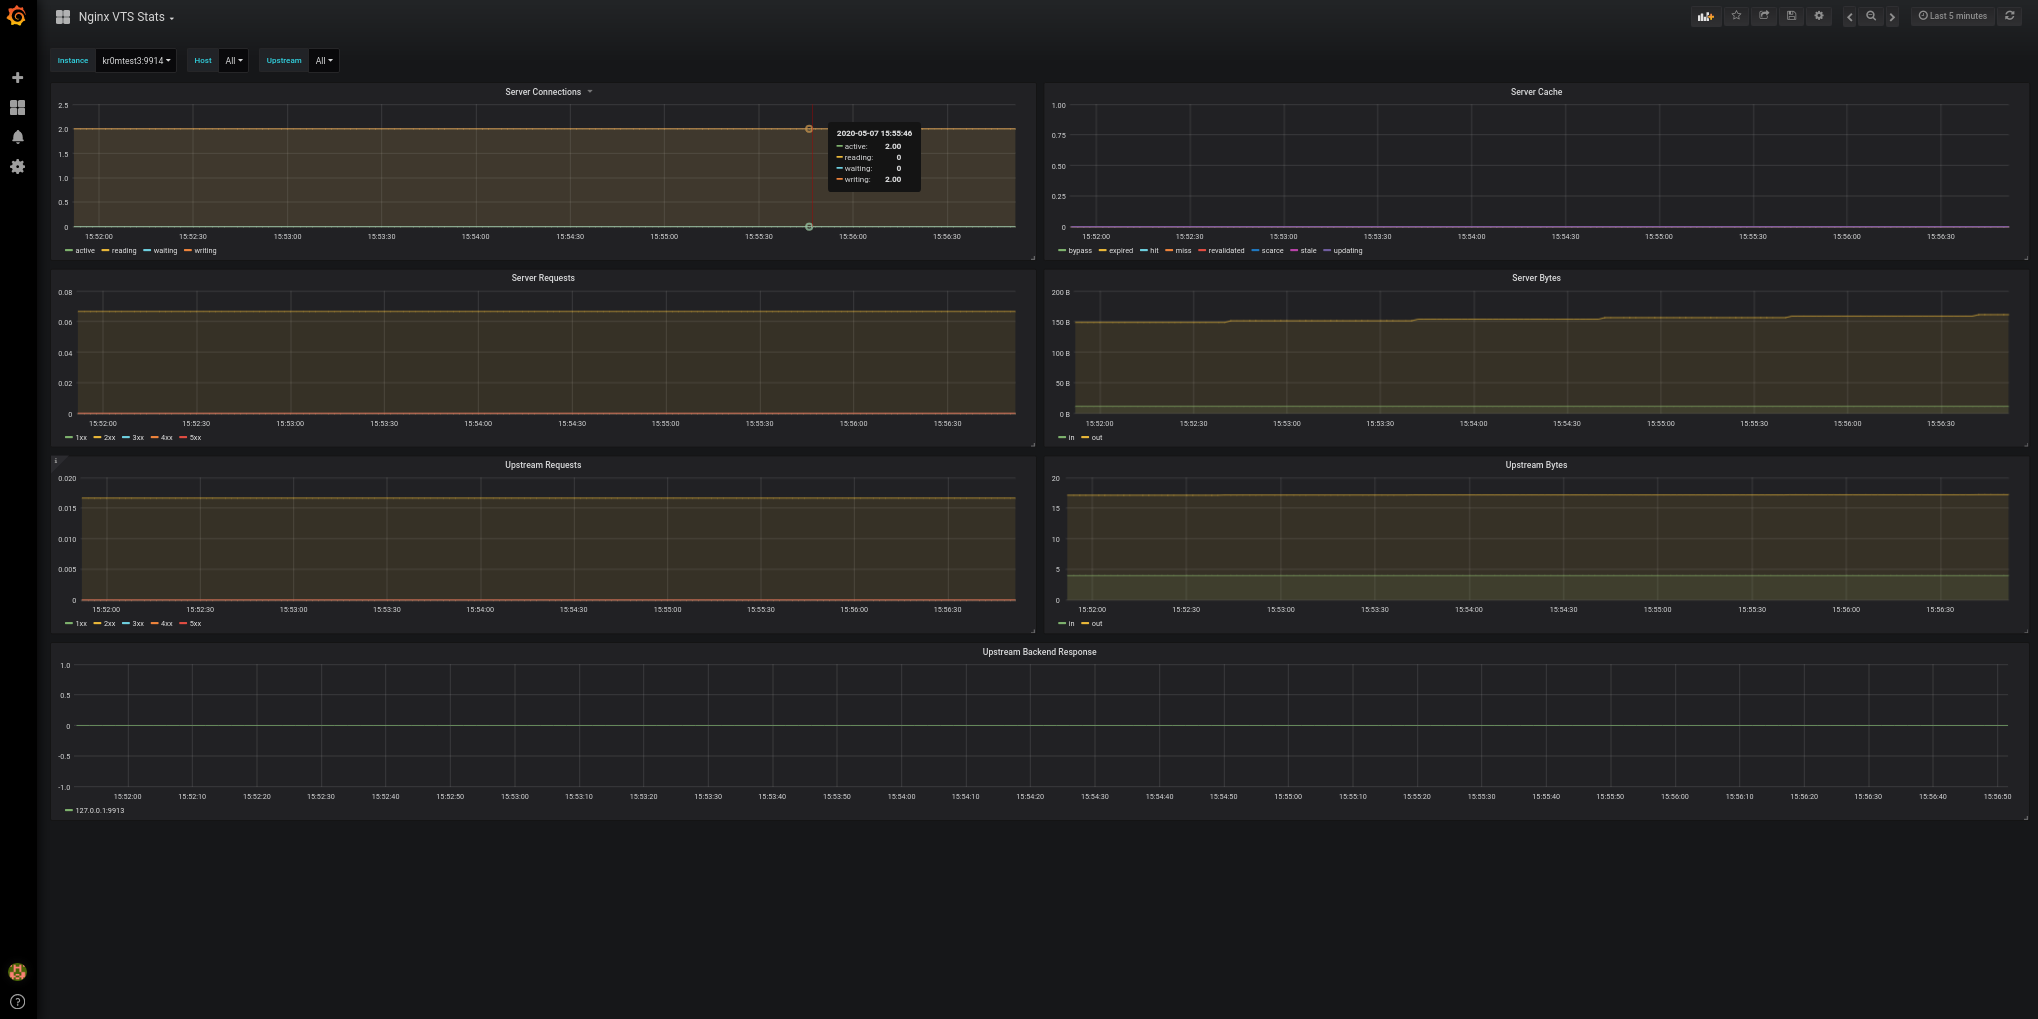
Now we just have to import the corresponding dashboard in Grafana and we will be able to visualize the data.
We go to Dashboards -> Manage
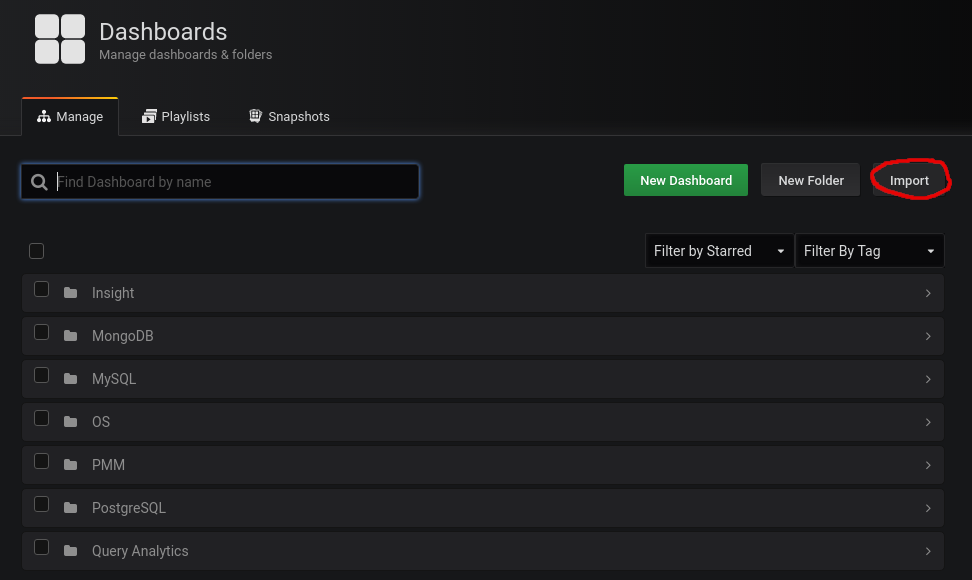
We import this dashboard:
https://grafana.com/grafana/dashboards/2949
To do this, we click on import:
We paste the dashboard id:
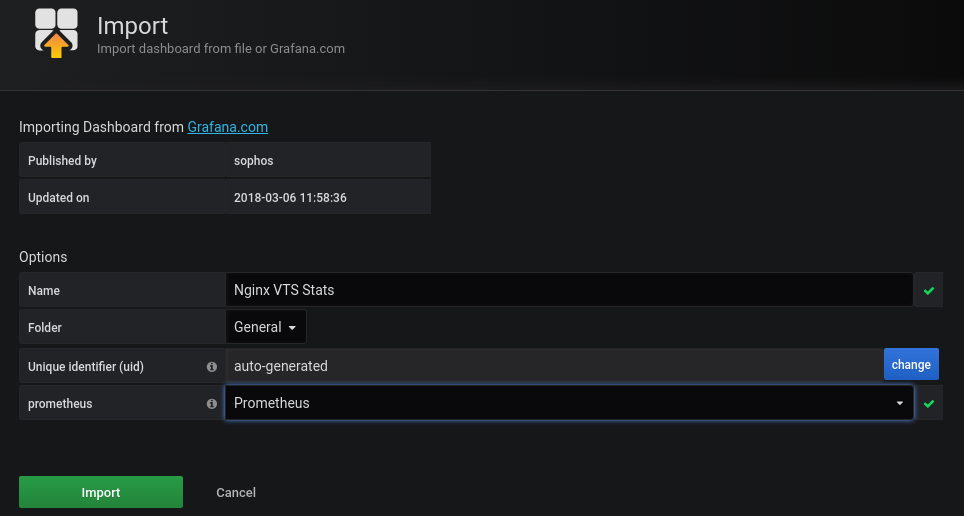
Now we can see the graphs:
The Prometheus alerts would be these, remember that in PMM2 the alerts are configured from Grafana ( http://pmm.alfaexploit.com/graph/d/pmm-settings/) :
groups:
- name: nginxRules
  rules:
  - alert: NginxDown
    expr: sum(up{job="nginxExporter"} == 0) by (instance)
    for: 5m
    labels:
      severity: critical
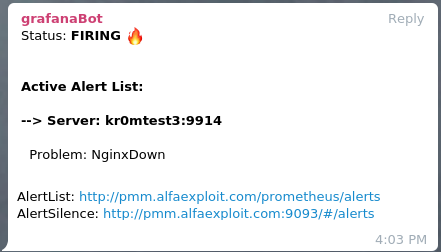
If we stop an Nginx, we can see the alarm:

If we have followed the guide on
Alertmanager
, we will see alerts like this on Telegram: