Starting from version 2.0 of Haproxy, it comes with the Prometheus exporter incorporated. This way, we can visualize a multitude of metrics through Grafana and receive alerts based on them. In this tutorial, I will explain how to configure it under PMM2.
We compile and install Haproxy with the prometheus-exporter option enabled:
emerge -av net-proxy/haproxy
The exporter configuration is done on the same port as the stats, but depending on the path, it will serve the stats or the metrics.
frontend stats
   bind :8405
   option http-use-htx
   http-request use-service prometheus-exporter if { path /metrics }
   stats enable
   stats uri /stats
   stats refresh 10s
We must protect access with a password. The complete configuration would be this:
global
        stats socket ipv4@0.0.0.0:9999 level admin
        stats socket /var/run/haproxy.sock mode 666 level admin
        stats timeout 2m

defaults
        option forwardfor
        option http-server-close

        mode    http
        timeout connect 5000
        timeout client  50000
        timeout server  50000

userlist statsuser
        user admin insecure-password PASSWORD

frontend stats
        bind :8405
        acl pmmserver src PMM_SERVER_IP/32
        acl statsauthok http_auth(statsuser)
        http-request auth if !pmmserver !statsauthok

        option http-use-htx
        http-request use-service prometheus-exporter if { path /metrics }
        stats enable
        stats uri /stats
        stats refresh 10s

frontend www-http
        bind *:80
        default_backend www-backend

backend www-backend
        server www00 SERVERIP:80 check
        server www01 SERVERIP:80 check
NOTE: With the above configuration, it will only ask for a password if the metrics are queried from an IP different from that of the PMM server.
We start Haproxy:
rc-update add haproxy default
We check that the services have been bound to the correct interfaces:
tcp 0 0 0.0.0.0:8405 0.0.0.0:* LISTEN 10154/haproxy
We can see the metrics by accessing the URL:
We check that the stats are still working normally:
http://SERVER_IP:8405/stats
admin/PASSWORD
We verify that Prometheus does not request a password:
We configure the scrape in Prometheus:
scrape_configs:
- job_name: haproxy
  scrape_interval: 1m
  scrape_timeout: 10s
  metrics_path: /metrics
  scheme: http
  static_configs:
  - targets:
    - SERVER_IP:8405
We reload the configuration:
In the targets section, we can see the exporter. In my case, I monitor two Haproxys:

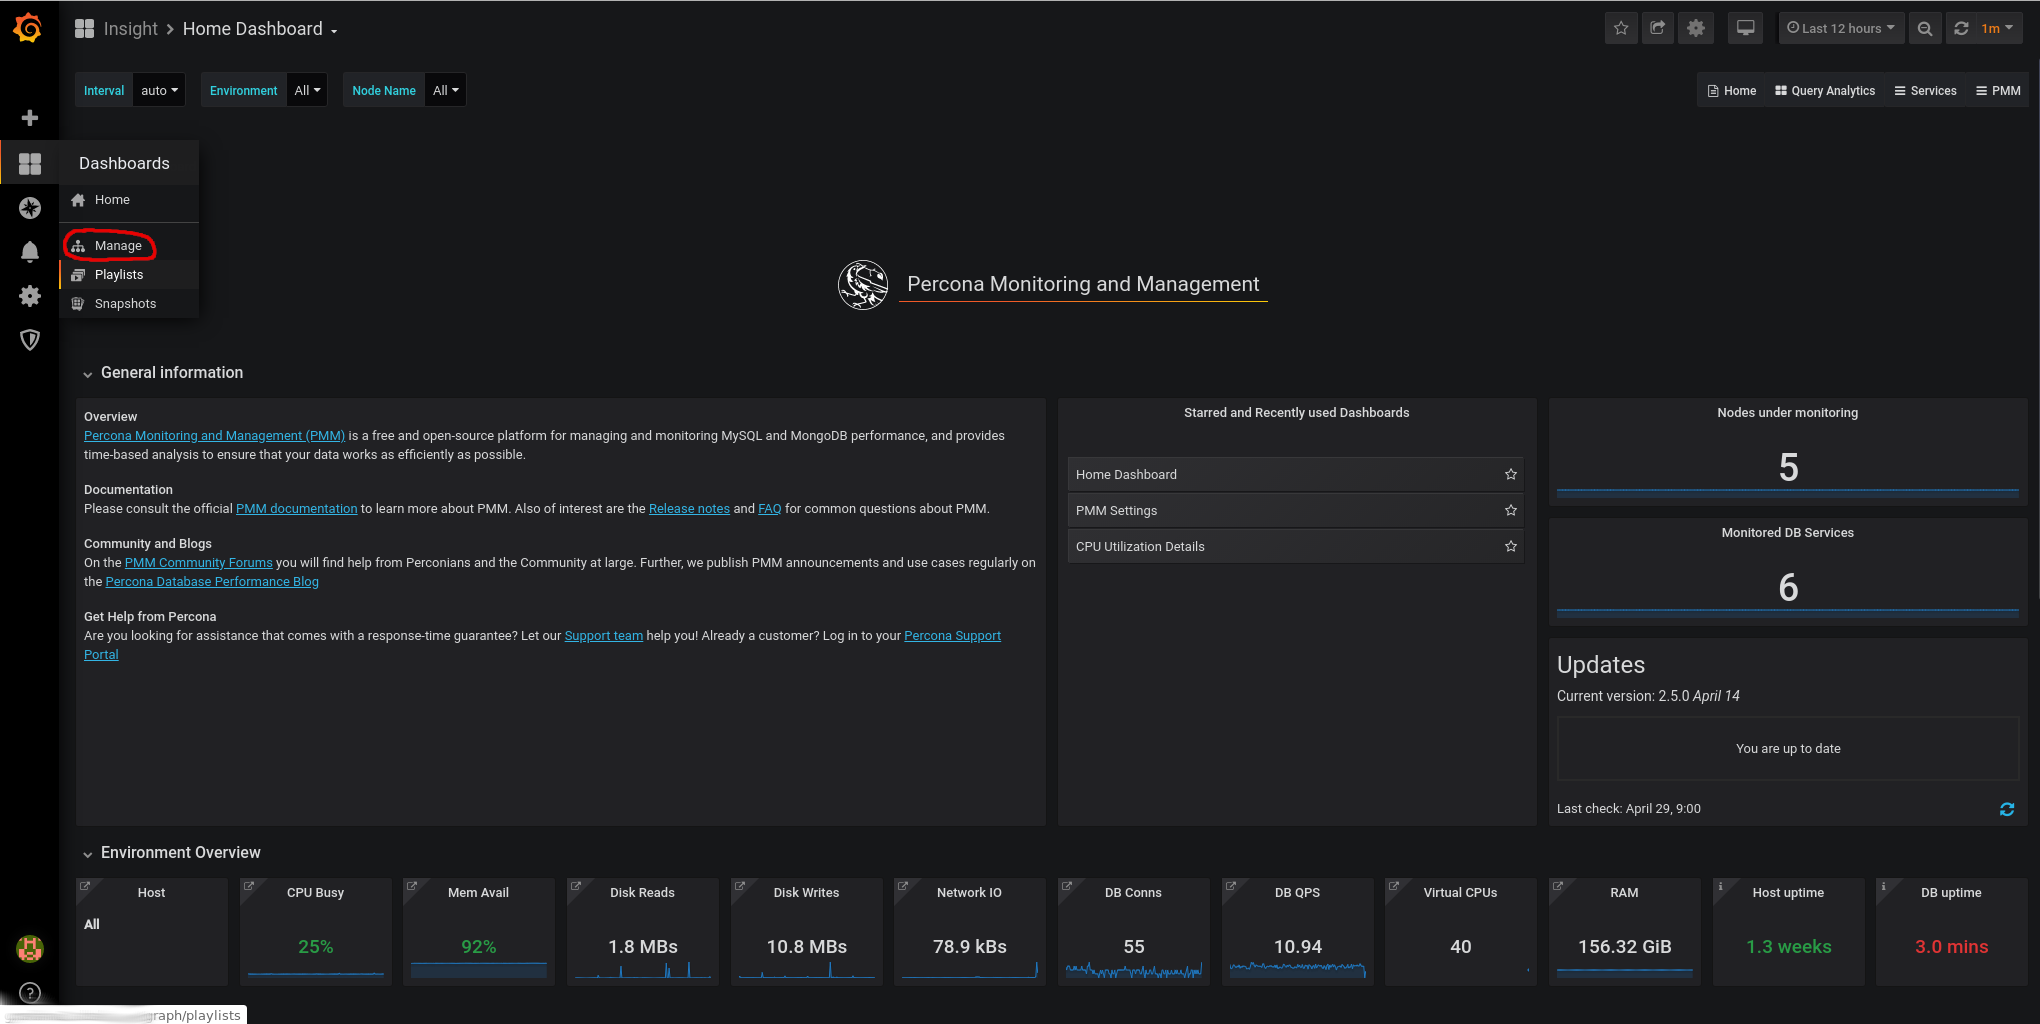
Now, we just need to import the corresponding dashboard in Grafana, and we can visualize the data.
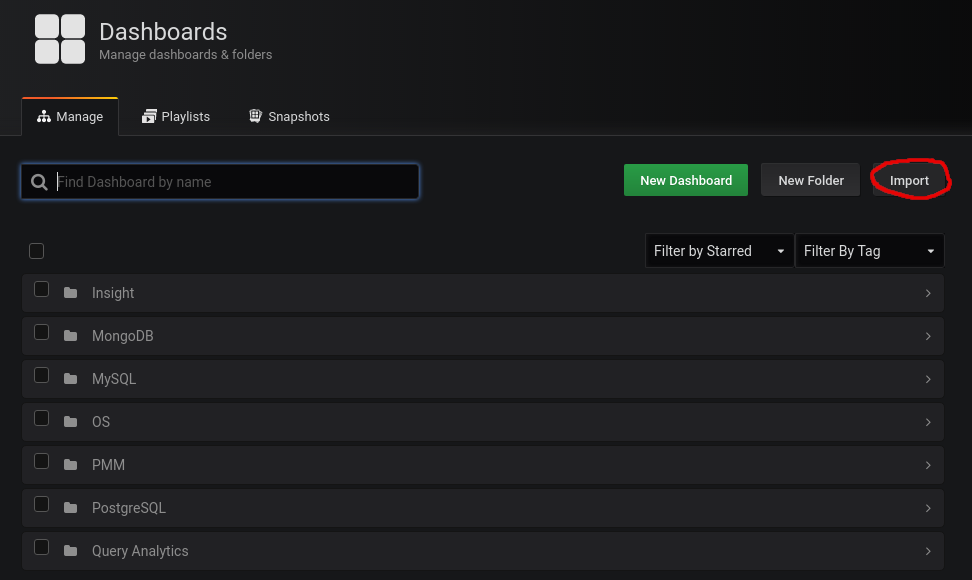
Go to Dashboards -> Manage
We import this dashboard:
https://grafana.com/grafana/dashboards/12693
In recent PMM versions (16/11/2022), I had to import this dashboard:
https://grafana.com/grafana/dashboards/16675-haproxy-2-full/
To do this, we click on import:
We paste the dashboard ID:
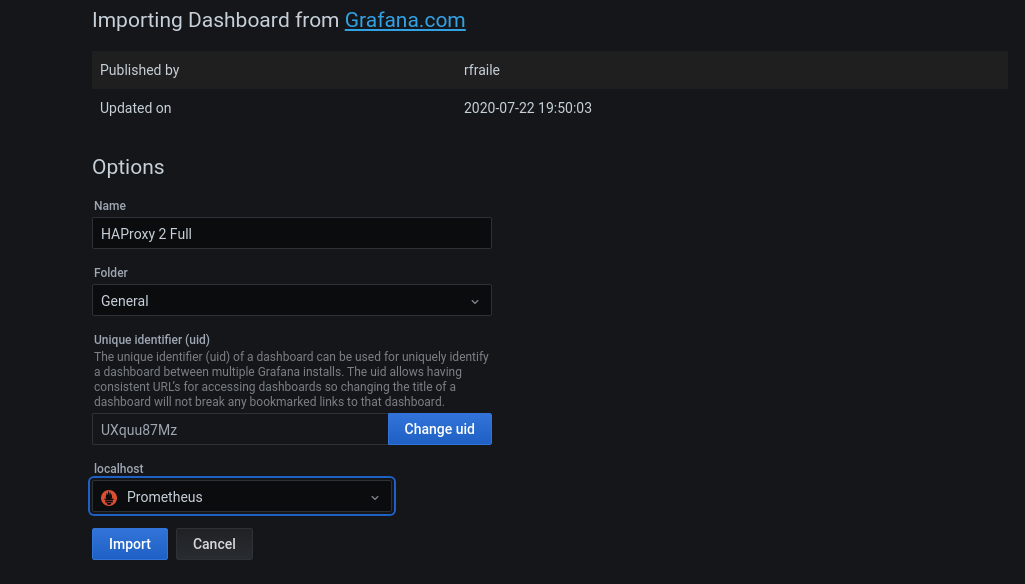
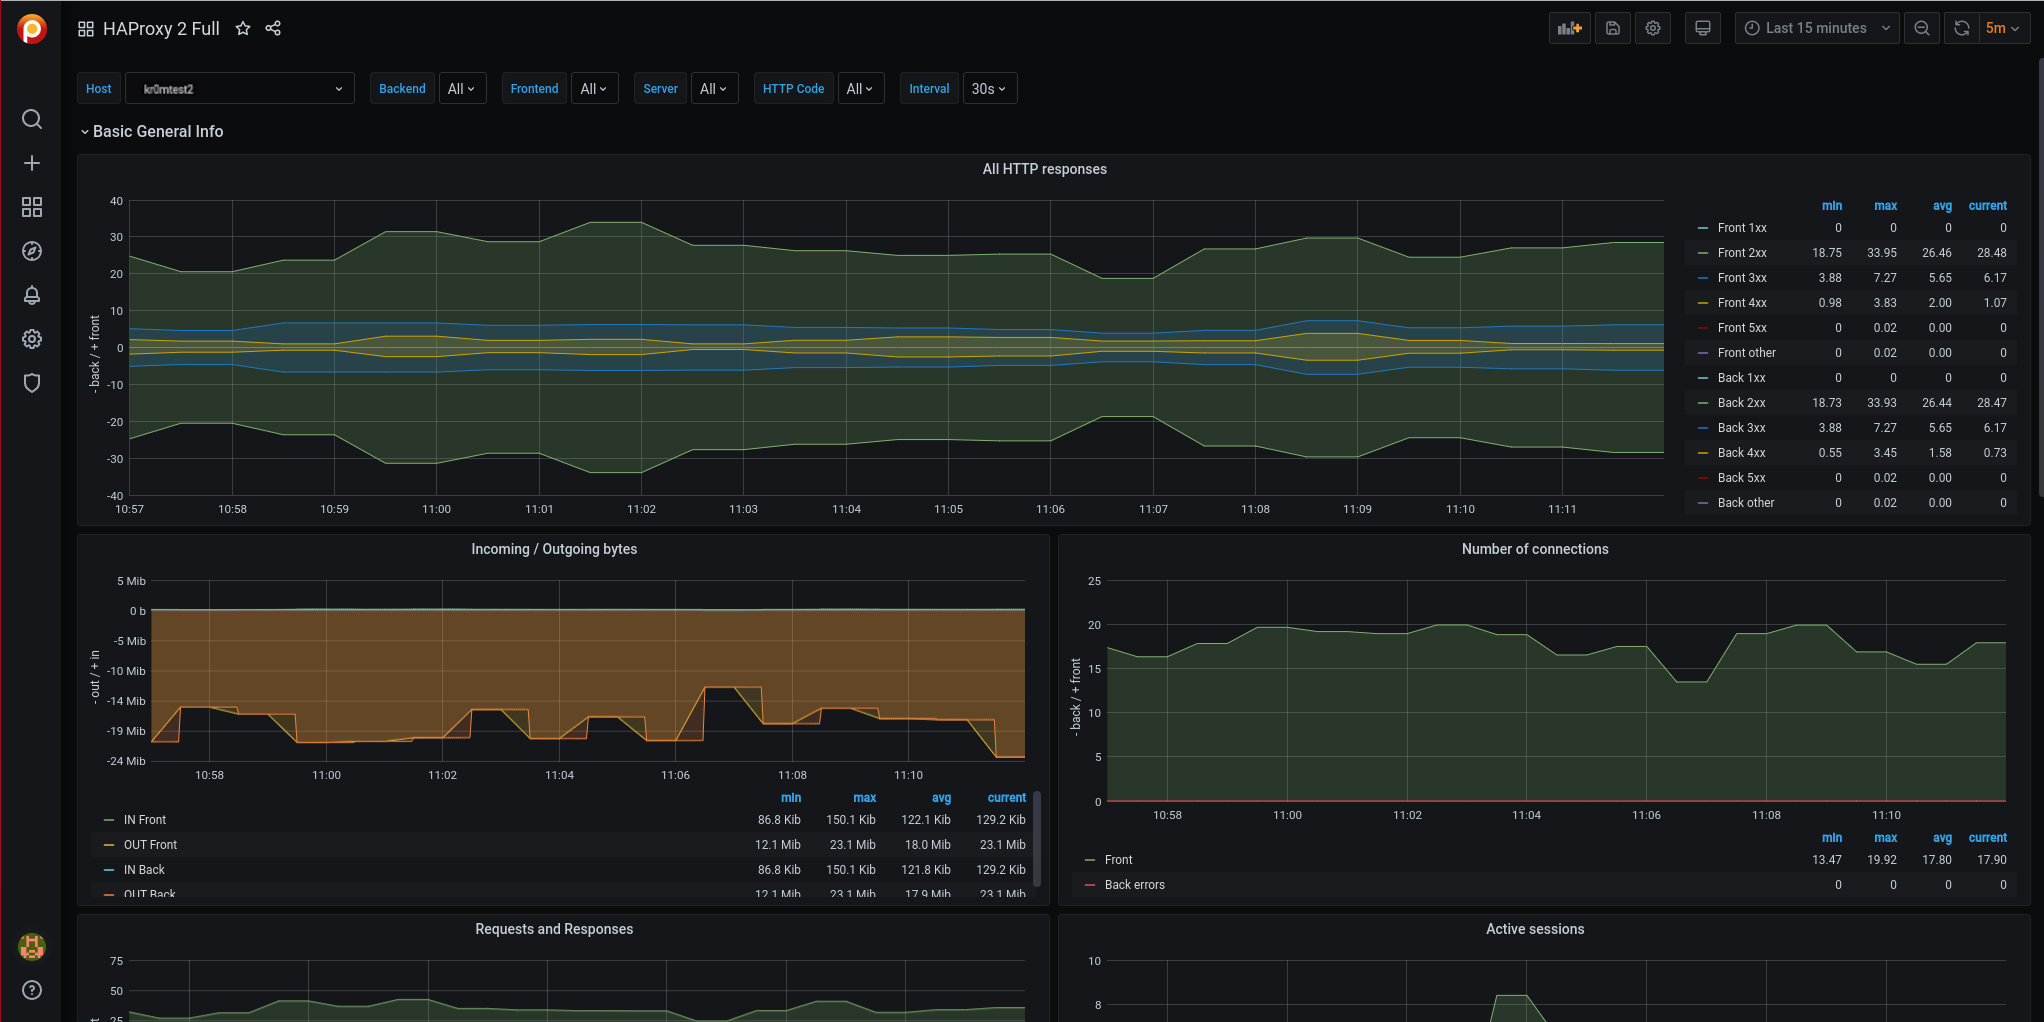
Now, we can visualize the graphs:
For the alert system, we can dump the metrics and define the alarms:
groups:
- name: haproxyRules
 rules:
 - alert: HaproxyDown
 expr: up{job="haproxy"} == 0
 for: 5m
 labels:
 severity: critical

 - alert: HaproxyHighHttp4xxErrorRate
 expr: sum(rate(haproxy_server_http_responses_total{code="4xx"}[1m])) by (server) / sum(rate(haproxy_server_http_responses_total{}[1m])) by (server) * 100 > 5
 for: 5m
 labels:
 severity: critical

 - alert: HaproxyHighHttp5xxErrorRate
 expr: sum(rate(haproxy_server_http_responses_total{code="5xx"}[1m])) by (server) / sum(rate(haproxy_server_http_responses_total{}[1m])) by (server) * 100 > 5
 for: 5m
 labels:
 severity: critical

 - alert: HaproxyBackendConnectionErrors
 expr: rate(haproxy_backend_connection_errors_total[1m]) * 100 > 5
 for: 5m
 labels:
 severity: critical

 - alert: HaproxyServerResponseErrors
 expr: rate(haproxy_server_response_errors_total[1m]) * 100 > 5
 for: 5m
 labels:
 severity: critical

 - alert: HaproxyServerConnectionErrors
 expr: rate(haproxy_server_connection_errors_total[1m]) * 100 > 5
 for: 5m
 labels:
 severity: critical

 - alert: HaproxyPendingRequests
 expr: haproxy_backend_current_queue > 0
 for: 5m
 labels:
 severity: warning

 - alert: HaproxyServerHealthcheckFailure
 expr: increase(haproxy_server_check_failures_total[1m]) > 0
 for: 5m
 labels:
 severity: warning

 - alert: HaproxyMaxConnectionsReached
 expr: (haproxy_process_max_connections - haproxy_process_current_connections) <= 0
 for: 5m
 labels:
 severity: critical

 - alert: BackendWithoutActiveServers
 expr: haproxy_backend_active_servers == 0
 for: 5m
 labels:
 severity: critical

 - alert: UnhealthyBackendStatus
 expr: haproxy_backend_status != 1
 for: 5m
 labels:
 severity: warning

 - alert: UnhealthyServerStatus
 expr: haproxy_server_status != 1
 for: 5m
 labels:
 severity: critical

 - alert: HaproxyFrontendSecurityBlockedRequests
 expr: rate(haproxy_frontend_requests_denied_total[1m]) > 10
 for: 5m
 labels:
 severity: warning
We reload the configuration:
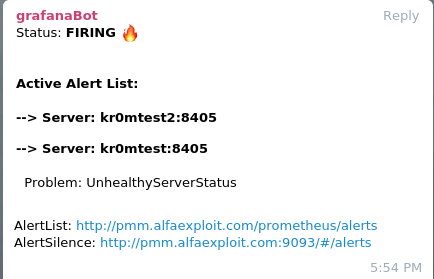
If we stop the haproxy, we will see the following alarm:

If we have followed the guide on
Alertmanager
, we will see alerts like this on Telegram:

If we stop a web server:

On Telegram: