By monitoring PowerDNS with PMM2, we will be able to detect problems in our DNS, service outages, errors, timeouts, corrupt packets, and even server load issues.
Continuing with the previous article , we will configure the exporter for PowerDNS. The exporter only supports PowerDNS-4.1.13(26/05/2020). If we install 4.2.1, we will only see three metrics:
powerdns_authoritative_exporter_json_parse_failures 0
powerdns_authoritative_exporter_total_scrapes 1
powerdns_authoritative_up 0
We check the available versions:
Available versions: 4.1.13^t ~4.2.0^t [m]4.2.1^t [m]~4.2.1-r1^t [m]~4.2.2^t [m]~4.3.0^t {botan debug doc geoip ldap libressl lua lua-records luajit mydns mysql opendbx postgres protobuf remote sodium sqlite systemd test tinydns tools}
We downgrade until the exporter is updated:
echo “>=net-dns/pdns-4.2.1” > /etc/portage/package.mask/pdns
We compile and install the indicated version:
To enable the exporter to query the data, we must enable the PowerDNS API.
MASTER:
cat >/etc/powerdns/pdns.conf «EOL
launch=gmysql
gmysql-host=127.0.0.1
gmysql-dbname=pdns
gmysql-user=pdns
gmysql-password=PASSWORD
setgid=pdns
setuid=pdns
local-address=MASTER_IP
master=yes
default-soa-name=ns1.alfaexploit.com.
allow-axfr-ips=SLAVE_IP
also-notify=SLAVE_IP
api=yes
api-key=PDNS_KEY
webserver=yes
webserver-address=127.0.0.1
webserver-allow-from=127.0.0.1/32
EOL
SLAVE:
cat >/etc/powerdns/pdns.conf «EOL
launch=gmysql
gmysql-host=127.0.0.1
gmysql-dbname=pdns
gmysql-user=pdns
gmysql-password=PASSWORD
setgid=pdns
setuid=pdns
local-address=SLAVE_IP
slave=yes
default-soa-name=ns1.alfaexploit.com.
allow-notify-from=MASTER_IP/32
api=yes
api-key=PDNS_KEY
webserver=yes
webserver-address=127.0.0.1
webserver-allow-from=127.0.0.1/32
EOL
Restart PowerDNS:
Check if the API works:
{
 "config_url": "/api/v1/servers/localhost/config{/config_setting}",
 "daemon_type": "authoritative",
 "id": "localhost",
 "type": "Server",
 "url": "/api/v1/servers/localhost",
 "version": "4.1.13",
 "zones_url": "/api/v1/servers/localhost/zones{/zone}"
}
The exporter is written in Go, so we install the Go compiler:
Download the exporter:
https://github.com/ledgr/powerdns_exporter
export GOPATH=/root/go
vi .bashrc
export GOPATH=/root/go
export GOPATH=$(go env GOPATH)
Copy it to a more appropriate path:
Start the exporter indicating the api-url as indicated in its documentation and binding it to the loopback since we are going to use Nginx to request credentials:
https://github.com/ledgr/powerdns_exporter
Daemonize the exporter and start it:
chmod 700 /etc/local.d/pdnsExporter.start
/etc/local.d/pdnsExporter.start
Compile and install Nginx:
Make a copy of the Nginx configuration file:
Leave the following configuration:
user nginx nginx;
worker_processes 1;
error_log /var/log/nginx/error_log info;
events {
 worker_connections 1024;
 use epoll;
}

http {
 include /etc/nginx/mime.types;
 default_type application/octet-stream;
 log_format main
  '$remote_addr - $remote_user [$time_local] '
  '"$request" $status $bytes_sent '
  '"$http_referer" "$http_user_agent" '
  '"$gzip_ratio"';
 client_header_timeout 10m;
 client_body_timeout 10m;
 send_timeout 10m;
 connection_pool_size 256;
 client_header_buffer_size 1k;
 large_client_header_buffers 4 2k;
 request_pool_size 4k;
 gzip off;
 output_buffers 1 32k;
 postpone_output 1460;
 sendfile on;
 tcp_nopush on;
 tcp_nodelay on;
 keepalive_timeout 75 20;
 ignore_invalid_headers on;
 index index.html;

    server {
        listen SERVER_IP:9120;
        server_name _;

        location / {
            satisfy any;
            allow  PMM_SERVER_IP/32;
            auth_basic "Restricted Content";
            auth_basic_user_file /etc/nginx/.htpasswd;
            deny   all;

            proxy_pass http://localhost:9120;
        }
    }
}
With this configuration, if the request comes from PMM, the metrics will be served, otherwise credentials will be required.
Generate the authentication file:
htpasswd -c /etc/nginx/.htpasswd admin
We start Nginx:
rc-update add nginx default
We check that we can access with the credentials:
We check that we can access from PMM without credentials:
We add the scrape to Prometheus:
scrape_configs:
- job_name: PowerDNS
  scrape_interval: 1m
  scrape_timeout: 10s
  metrics_path: /metrics
  scheme: http
  static_configs:
  - targets:
    - kr0mtest:9120
    - kr0mtest2:9120
We reload the configuration:
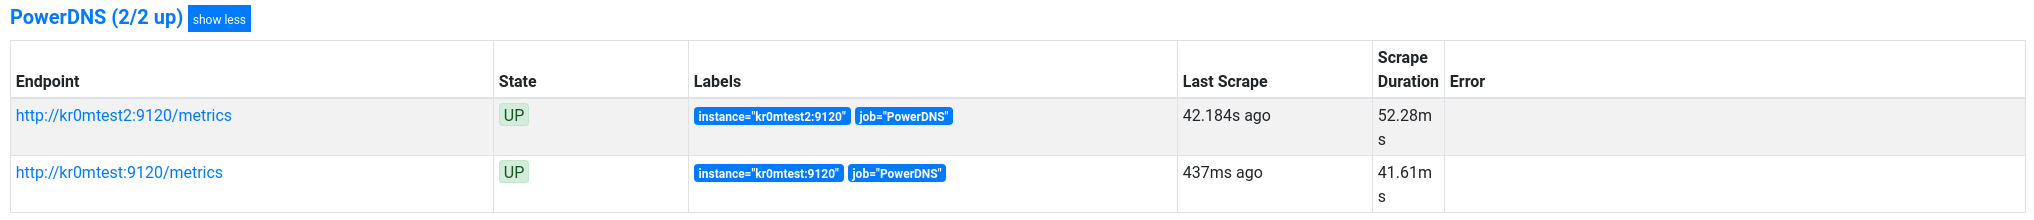
We can see the exporters in targets:
Unfortunately, there is no Grafana dashboard, so if we want one, we will have to create the panels with the relevant queries.
The metrics shown by the exporter only go up, so to detect problems we must calculate a delta of the data:
groups:
- name: pdnsRules
rules:
- alert: PowerDNSExporterDown
expr: sum(up{job="PowerDNS"} == 0) by (instance)
for: 5m
labels:
severity: critical
- alert: PowerDNSBackendOverload
expr: delta(powerdns_authoritative_exceptions_total{error="backend_overload"}[5m]) > 5
for: 5m
labels:
severity: critical
- alert: PowerDNSCorruptPackets
expr: delta(powerdns_authoritative_exceptions_total{error="corrupt_packets"}[5m]) > 5
for: 5m
labels:
severity: critical
- alert: PowerDNSRcvBufferErrors
expr: delta(powerdns_authoritative_exceptions_total{error="recvbuf_errors"}[5m]) > 5
for: 5m
labels:
severity: critical
- alert: PowerDNSServerDown
expr: delta(powerdns_authoritative_exceptions_total{error="servfail"}[5m]) > 5
for: 5m
labels:
severity: critical
- alert: PowerDNSSndBufferErrors
expr: delta(powerdns_authoritative_exceptions_total{error="sndbuf_errors"}[5m]) > 5
for: 5m
labels:
severity: critical
- alert: PowerDNSTimeoutErrors
expr: delta(powerdns_authoritative_exceptions_total{error="timeout"}[5m]) > 5
for: 5m
labels:
severity: critical
- alert: PowerDNSUdpInputErrors
expr: delta(powerdns_authoritative_exceptions_total{error="udo_in_errors"}[5m]) > 5
for: 5m
labels:
severity: critical
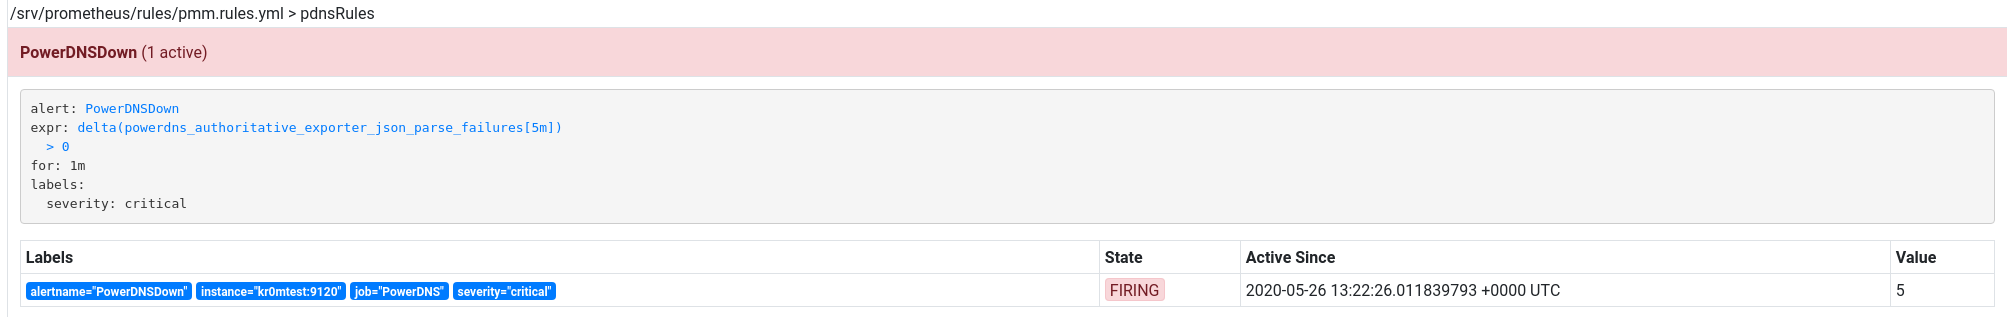
- alert: PowerDNSDown
expr: delta(powerdns_authoritative_exporter_json_parse_failures[5m]) > 0
for: 1m
labels:
severity: critical
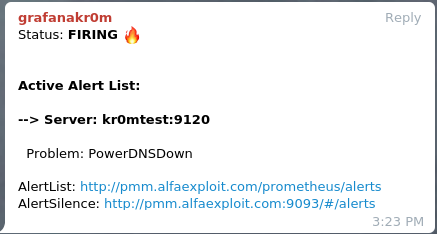
If we stop a PowerDNS, we will see the alert:
If we have followed the guide on
Alertmanager
, we will see alerts like this in Telegram: