In this article, we will learn how to monitor both an ElasticSearch instance and a cluster using PMM2. This way, we will receive alerts for any possible issues with our database. The article describes how to monitor the service using PMM2, configure alerts with Alertmanager, and visualize metrics using Grafana.
We will use the official exporter from the
Prometheus website
:
https://github.com/justwatchcom/elasticsearch_exporter
To compile the exporter, Git and Go are required:
Compile the exporter:
export GOPATH=/root/go
export GOPATH=$(go env GOPATH)
go get -u github.com/justwatchcom/elasticsearch_exporter
cd /root/go/bin/
Check the existence of the binary:
-rwxr-xr-x 1 root root 12229816 nov 25 15:39 elasticsearch_exporter
Bind the exporter to the loopback as we will set up an Nginx in front of it to request credentials:
nohup /root/go/bin/elasticsearch_exporter --web.listen-address="127.0.0.1:9114" &
Assign the necessary permissions and start the service:
/etc/local.d/elasticsearch_exporter.start
Check that it has been bound to the correct IP:
tcp 0 0 127.0.0.1:9114 0.0.0.0:* LISTEN 7751/elasticsearch_
If our configuration requires any special parameters because the ElasticSearch service is bound to another IP, requires user/pass, or any other peculiarity, we must indicate it through the appropriate parameter. Running the exporter with the --help parameter will show us the list:
usage: elasticsearch_exporter [<flags>]

Flags:
  -h, --help                 Show context-sensitive help (also try --help-long and --help-man).
      --web.listen-address=":9114"
                             Address to listen on for web interface and telemetry.
      --web.telemetry-path="/metrics"
                             Path under which to expose metrics.
      --es.uri="http://localhost:9200"
                             HTTP API address of an Elasticsearch node.
      --es.timeout=5s        Timeout for trying to get stats from Elasticsearch.
      --es.all               Export stats for all nodes in the cluster. If used, this flag will override the flag es.node.
      --es.node="_local"     Node's name of which metrics should be exposed.
      --es.indices           Export stats for indices in the cluster.
      --es.indices_settings  Export stats for settings of all indices of the cluster.
      --es.cluster_settings  Export stats for cluster settings.
      --es.shards            Export stats for shards in the cluster (implies --es.indices).
      --es.snapshots         Export stats for the cluster snapshots.
      --es.clusterinfo.interval=5m
                             Cluster info update interval for the cluster label
      --es.ca=""             Path to PEM file that contains trusted Certificate Authorities for the Elasticsearch connection.
      --es.client-private-key=""
                             Path to PEM file that contains the private key for client auth when connecting to Elasticsearch.
      --es.client-cert=""    Path to PEM file that contains the corresponding cert for the private key to connect to Elasticsearch.
      --es.ssl-skip-verify   Skip SSL verification when connecting to Elasticsearch.
      --log.level="info"     Sets the loglevel. Valid levels are debug, info, warn, error
      --log.format="logfmt"  Sets the log format. Valid formats are json and logfmt
      --log.output="stdout"  Sets the log output. Valid outputs are stdout and stderr
      --version              Show application version.
We compile Nginx:
We configure Nginx to prompt for a password when the request does not come from the PMM server:
...
server {
  listen SERVER_IP:9114;
  server_name _;

  location / {
      satisfy any;
      allow  PMM_SERVER_IP/32;
      auth_basic "Restricted Content";
      auth_basic_user_file /etc/nginx/.htpasswd;
      deny   all;

      proxy_pass http://127.0.0.1:9114;
  }
}
...
We generate the password file:
htpasswd -c /etc/nginx/.htpasswd admin
We restart Nginx:
We check that it does not prompt for a password from the PMM server:
And that it does prompt for a password from anywhere else:
We configure the Prometheus scrape:
scrape_configs:
- job_name: elasticsearch
  static_configs:
  - targets:
    - SERVER_IP:9114
  labels:
    service: elasticsearch
  relabel_configs:
  - source_labels: [__address__]
    regex: '(.*)\:9114'
    target_label:  'instance'
    replacement:   '$1'
  - source_labels: [__address__]
    regex: '(.*)\:9114'
    target_label:  'node_name'
    replacement:   '$1'
  - source_labels: [__address__]
    regex:         '.*\.(.*)\.lan.*'
    target_label:  'environment'
    replacement:   '$1'
We reload the configuration:
To visualize the metrics, import the following dashboard in Grafana:
https://grafana.com/grafana/dashboards/2322
NOTE: The dashboard that comes with the exporter seems to not display many of the metrics, possibly due to the ElasticSearch version?
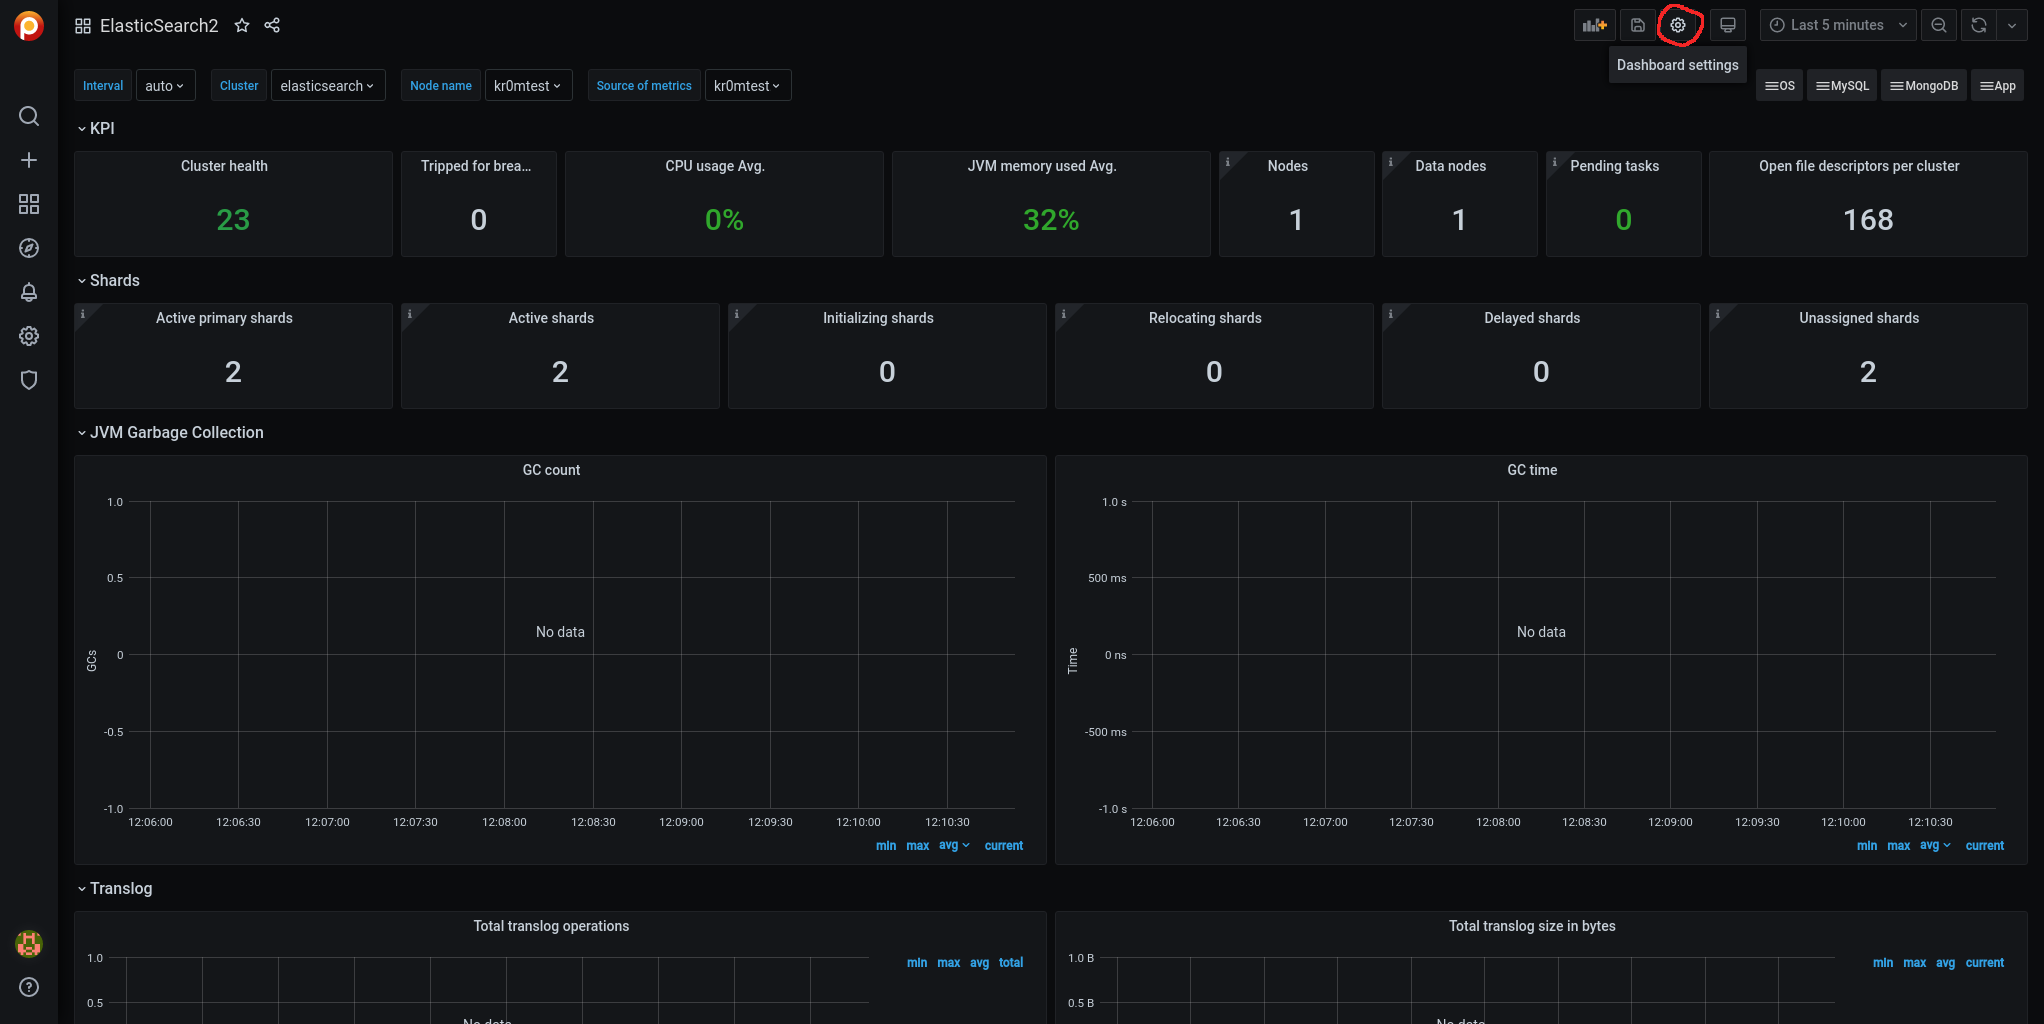
There are some metrics that do not appear when the Interval variable is set to Auto. We modify the variable.
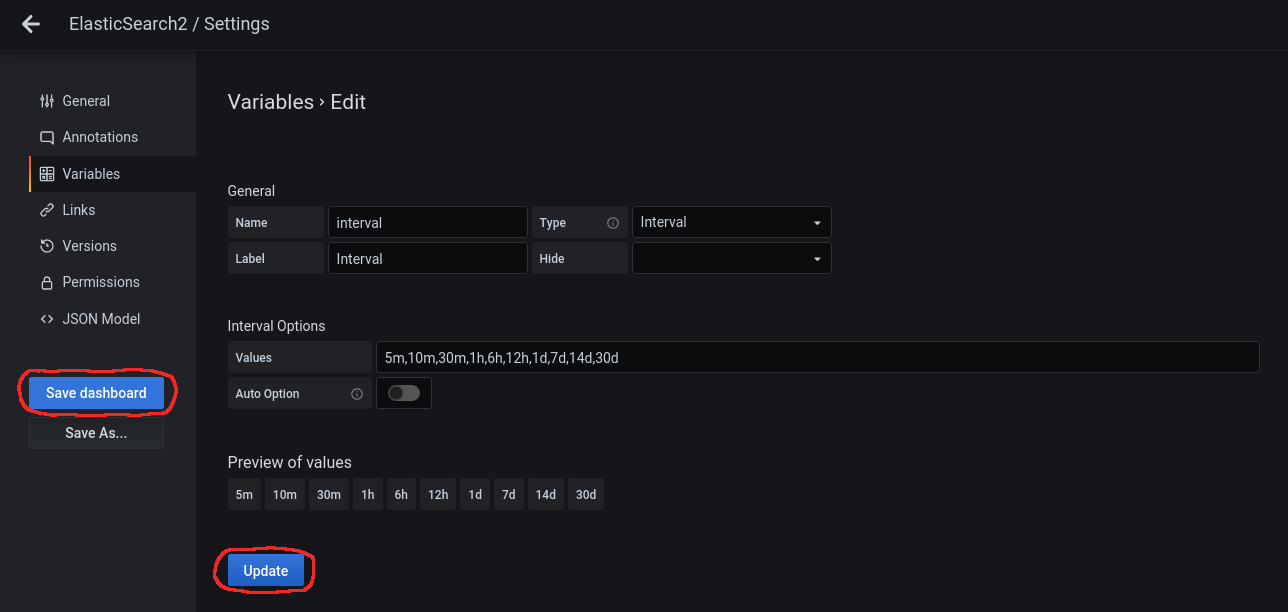
Access Dashboard Settings:
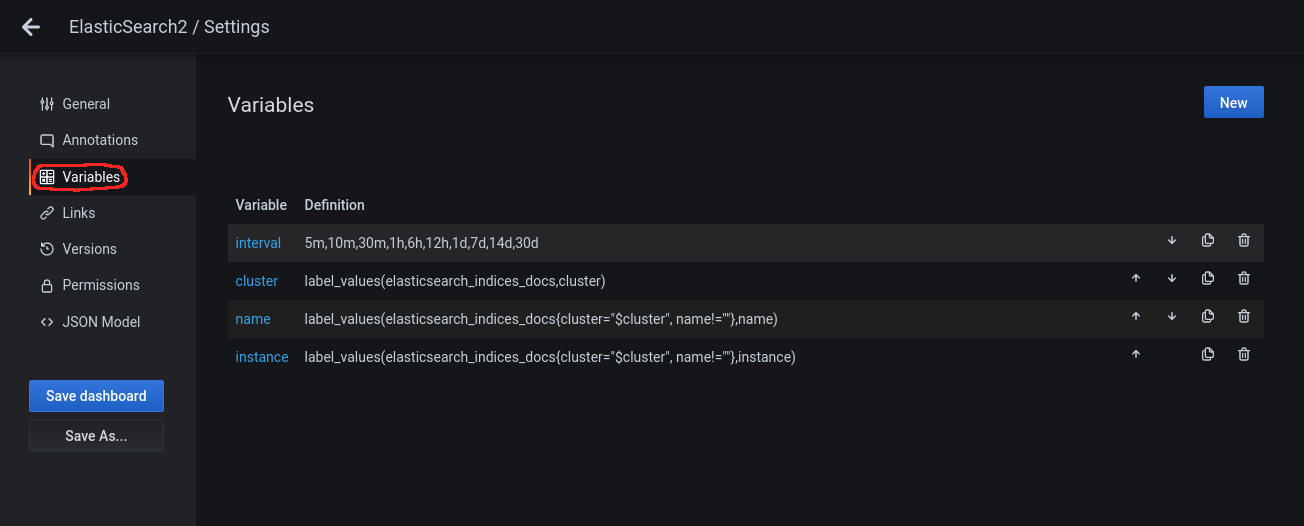
Access the Variables side panel:
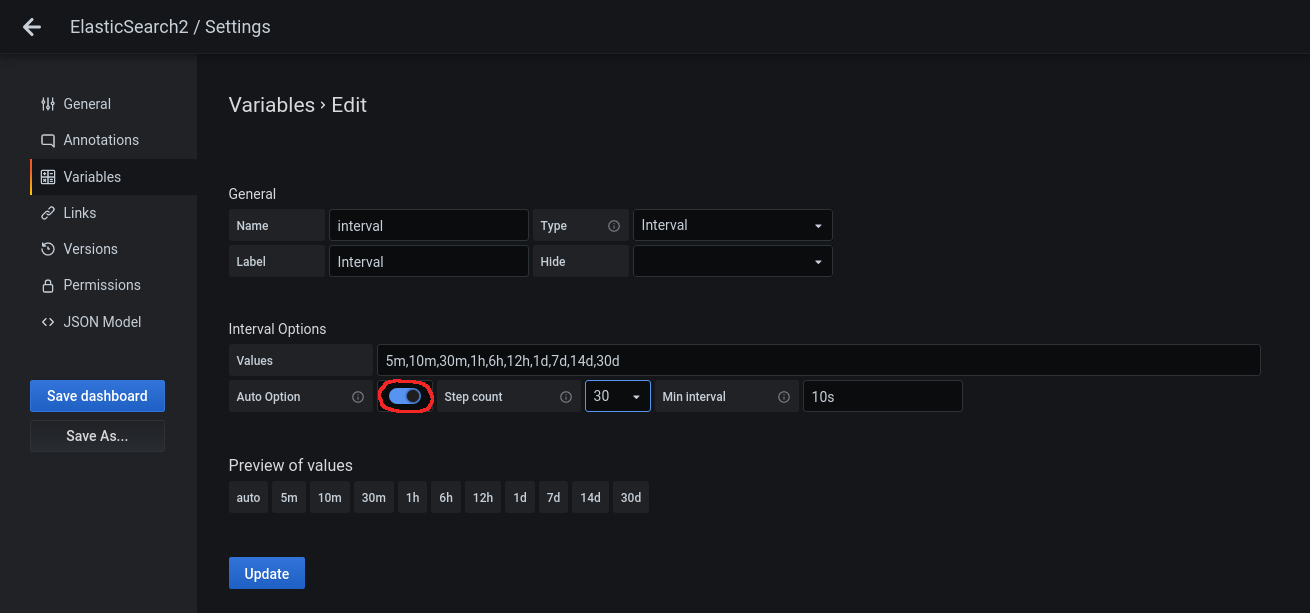
Click on the variable to edit it and disable the Auto Option in Interval Options:
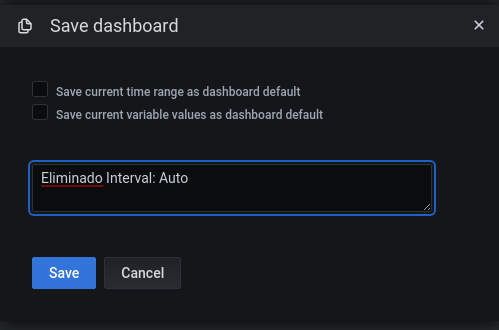
We click on Update and then on Save dashboard:
It will ask us for a comment:
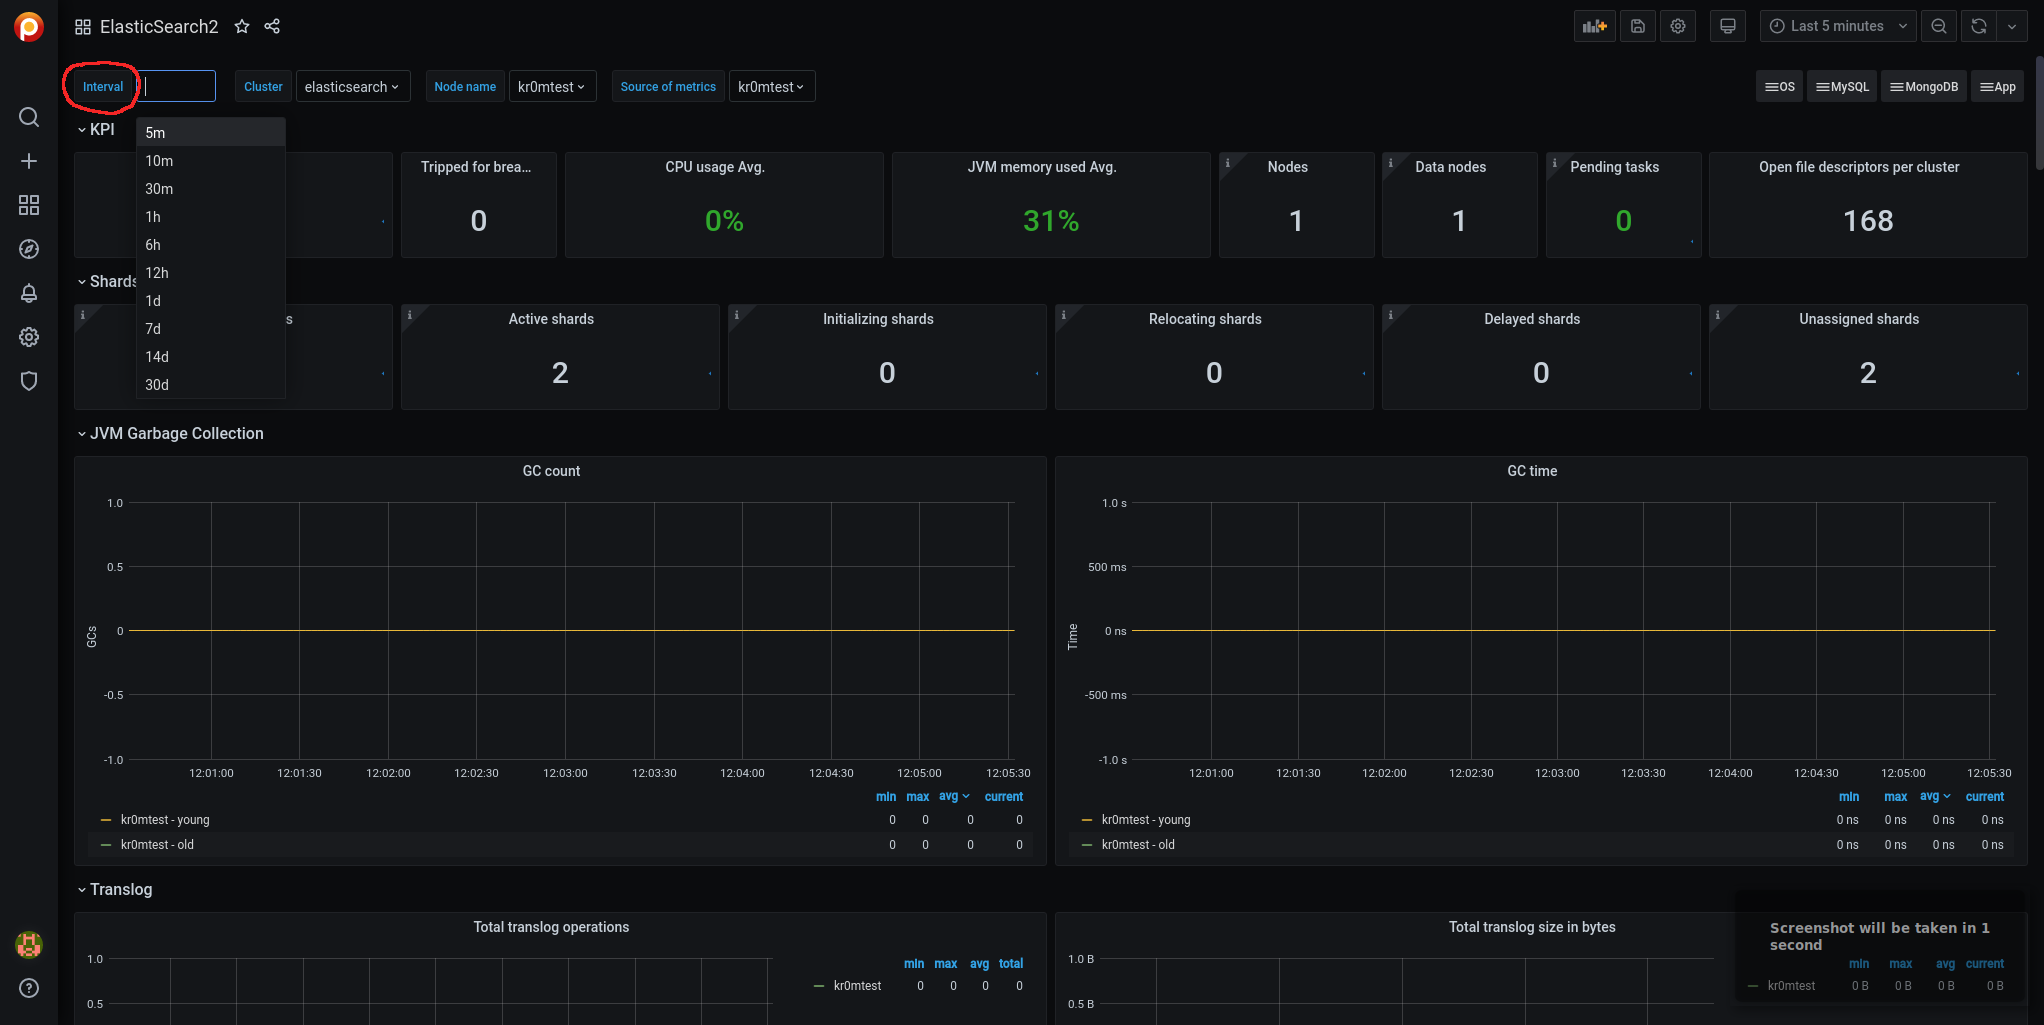
We go back using the arrow at the top left:

Now we will see data for many metrics that were not visible before, and in the dropdown menu, we can see that the Auto option is not available:
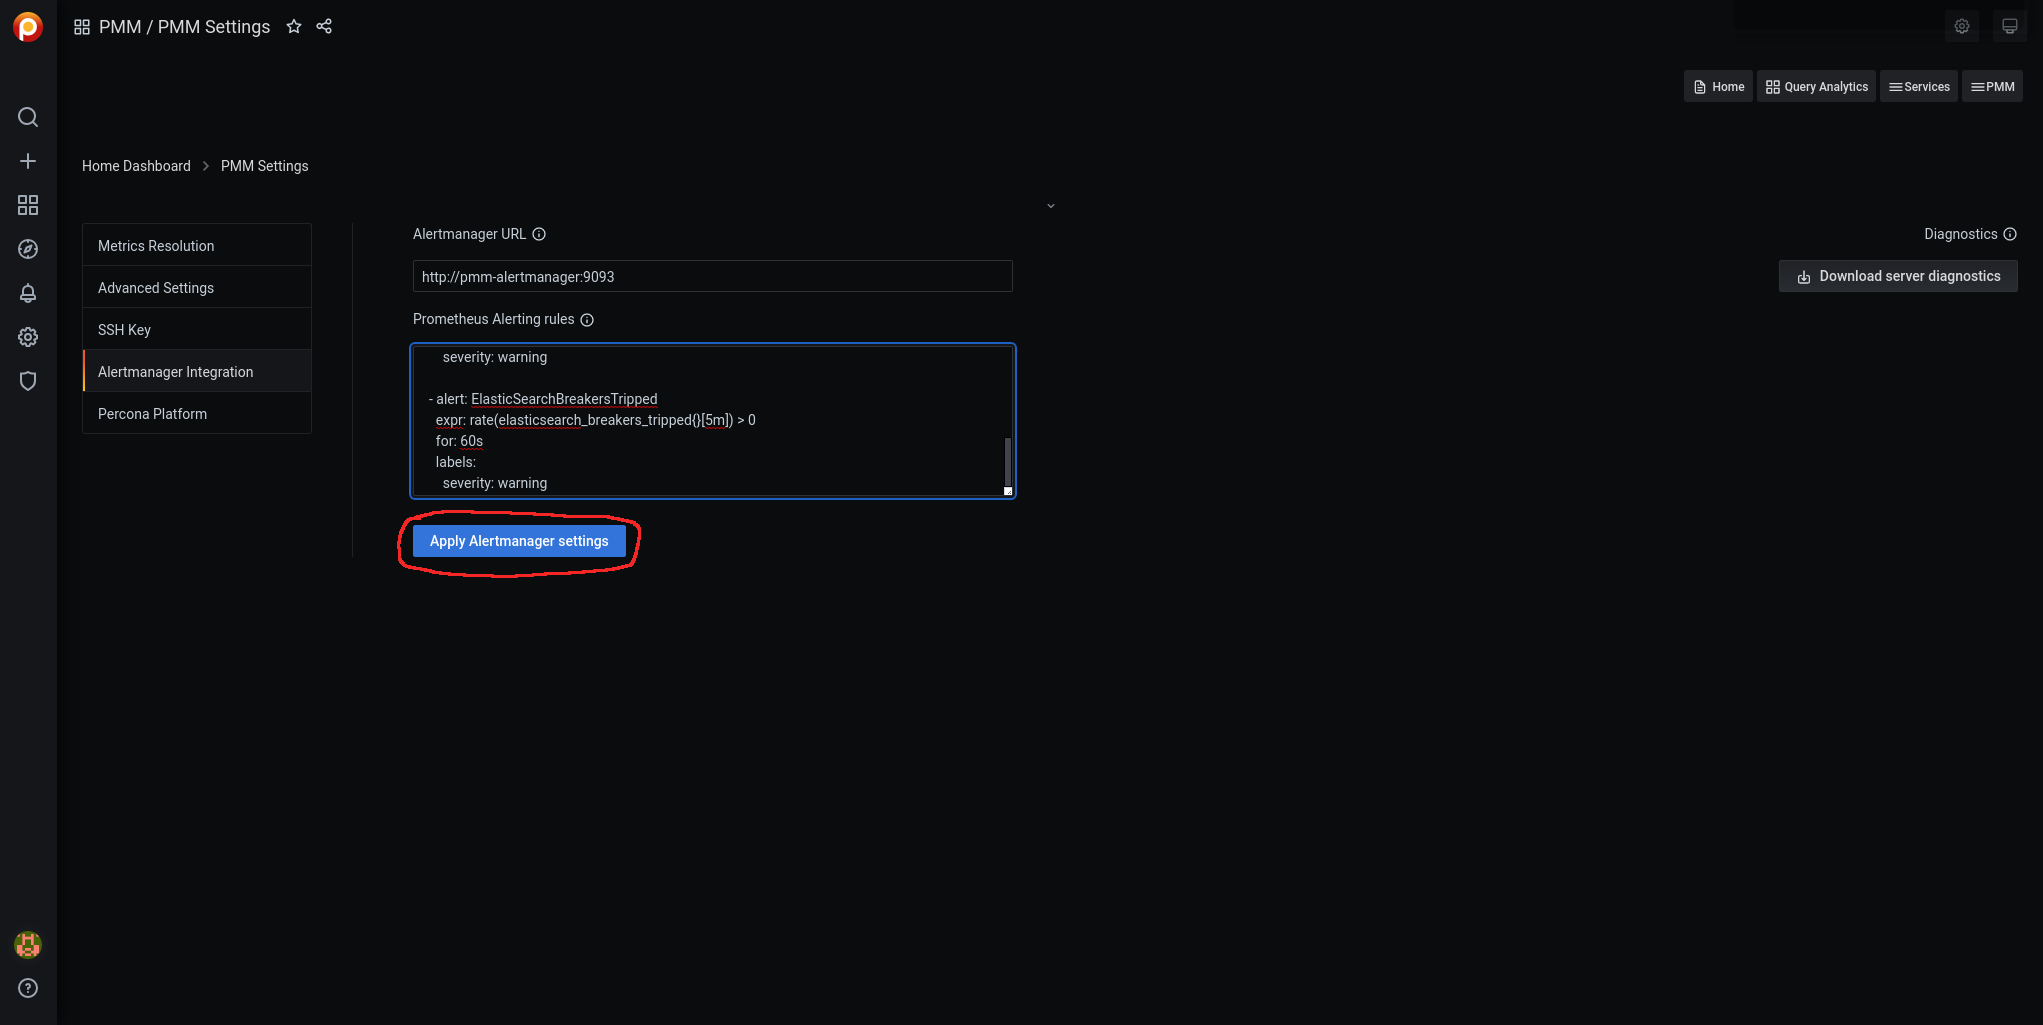
To load the alarms, we navigate through Grafana to pmm-settings:

We access Alertmanager Integration:
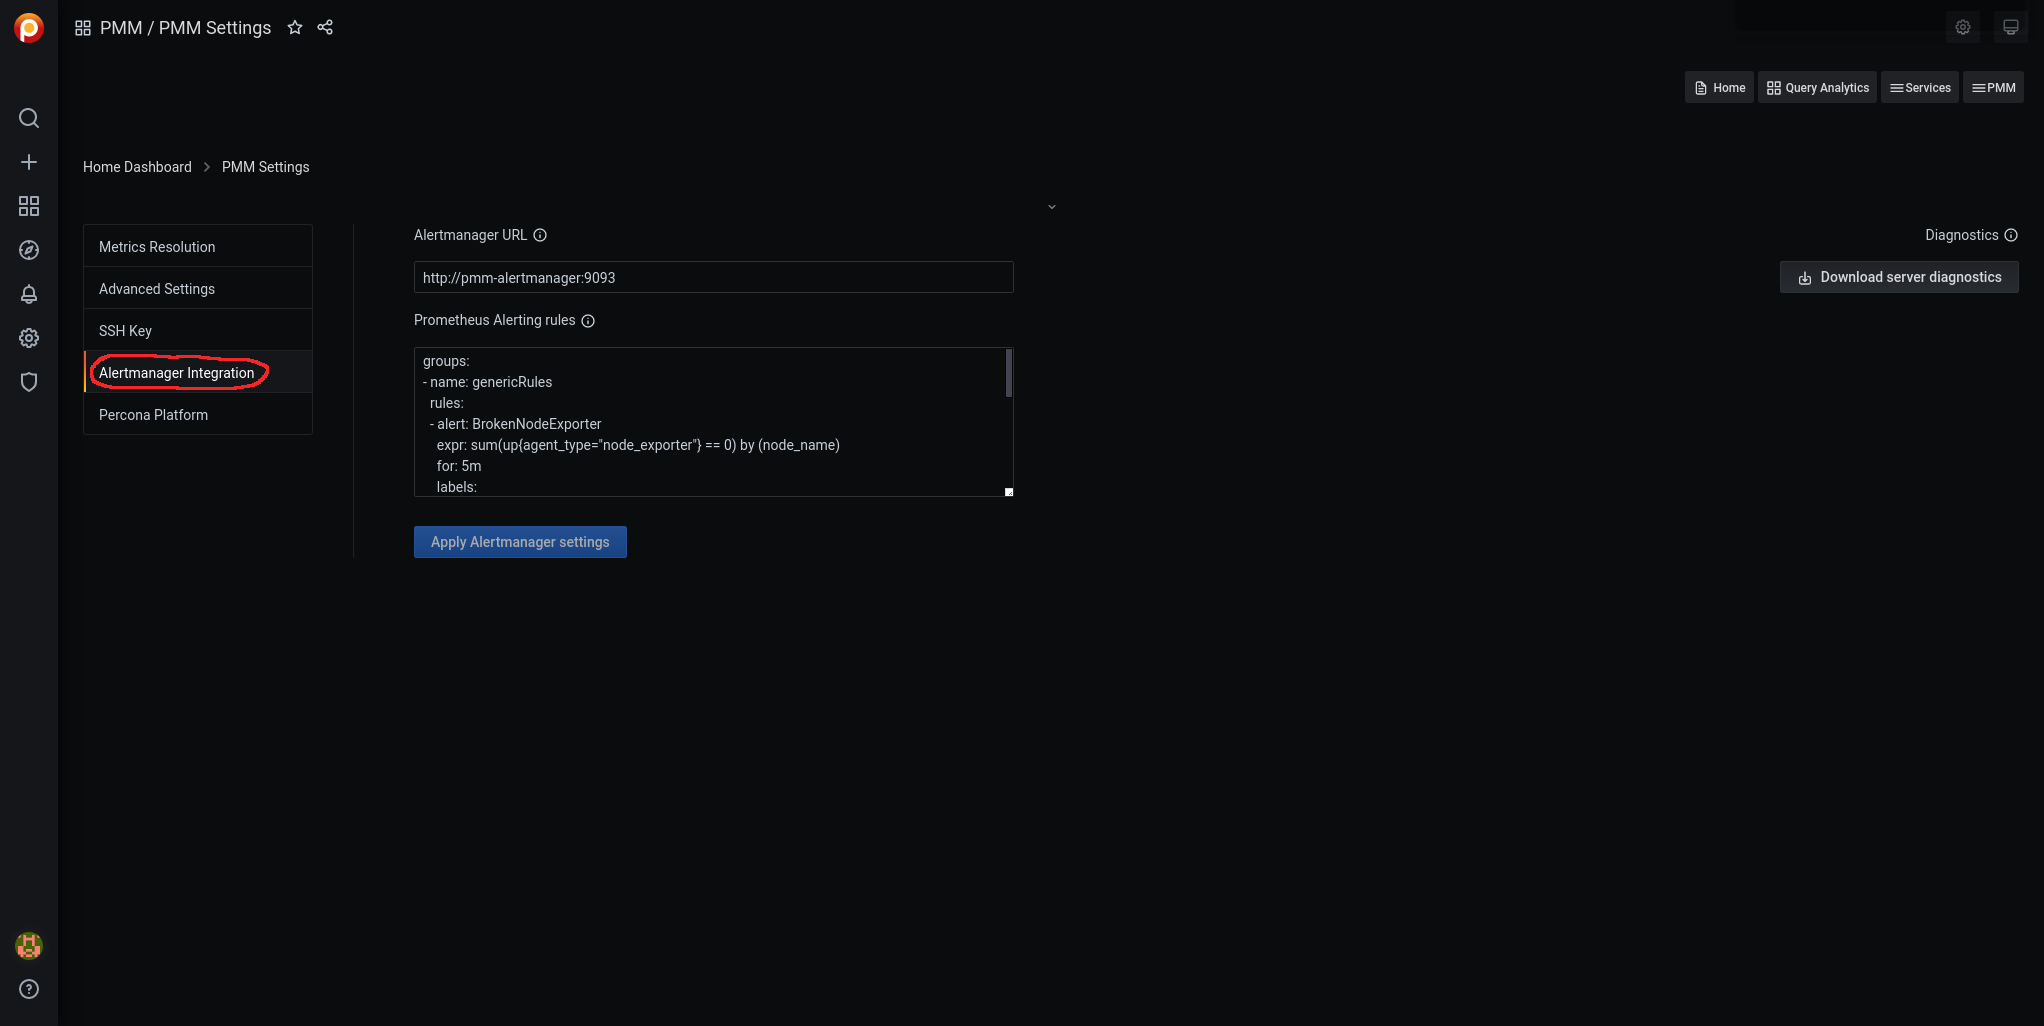
We edit the Prometheus Alerting rules:
- name: ElasticSearchRules
  rules:
  - alert: ElasticSearchExporterDown
    expr: up{job="elasticsearch"} == 0
    for: 5m
    labels:
      severity: critical

  - alert: ElasticSearchDown
    expr: elasticsearch_node_stats_up{job="elasticsearch"} == 0
    for: 5m
    labels:
      severity: critical

  - alert: ElasticSearchClusterHealthRED
    expr: elasticsearch_cluster_health_status{color="red"} == 1
    for: 5m
    labels:
      severity: critical

  - alert: ElasticSearchClusterHealthYellow
    expr: elasticsearch_cluster_health_status{color="yellow", cluster!="elasticsearch"} == 1
    for: 5m
    labels:
      severity: warning

  - alert: ElasticSearchJVMHeapTooHigh
    expr: elasticsearch_jvm_memory_used_bytes{area="heap"} / elasticsearch_jvm_memory_max_bytes{area="heap"} > 0.8
    for: 5m
    labels:
      severity: warning

  - alert: ElasticSearchTooFewNodesRunning
    expr: elasticsearch_cluster_health_number_of_nodes{cluster!="elasticsearch"} < 3
    for: 5m
    labels:
      severity: warning

  - alert: ElasticSearchCountOfJvmGcRuns
    expr: rate(elasticsearch_jvm_gc_collection_seconds_count{}[5m]) > 5
    for: 60s
    labels:
      severity: warning

  - alert: ElasticSearchGCRunTime
    expr: rate(elasticsearch_jvm_gc_collection_seconds_sum[5m]) > 0.3
    for: 60s
    labels:
      severity: warning

  - alert: ElasticSearchJsonParseFailures
    expr: elasticsearch_cluster_health_json_parse_failures > 0
    for: 60s
    labels:
      severity: warning

  - alert: ElasticSearchBreakersTripped
    expr: rate(elasticsearch_breakers_tripped{}[5m]) > 0
    for: 60s
    labels:
      severity: warning
NOTE: The alerts for the cluster do not take into account the instances with cluster=“elasticsearch” since it is the name of the cluster when ElasticSearch was installed in standalone mode.
We click on Apply Alertmanager settings:
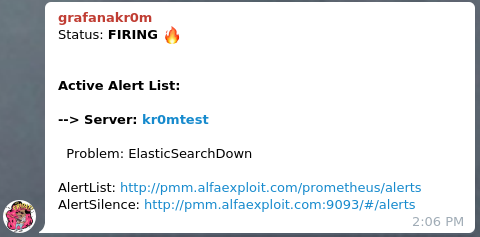
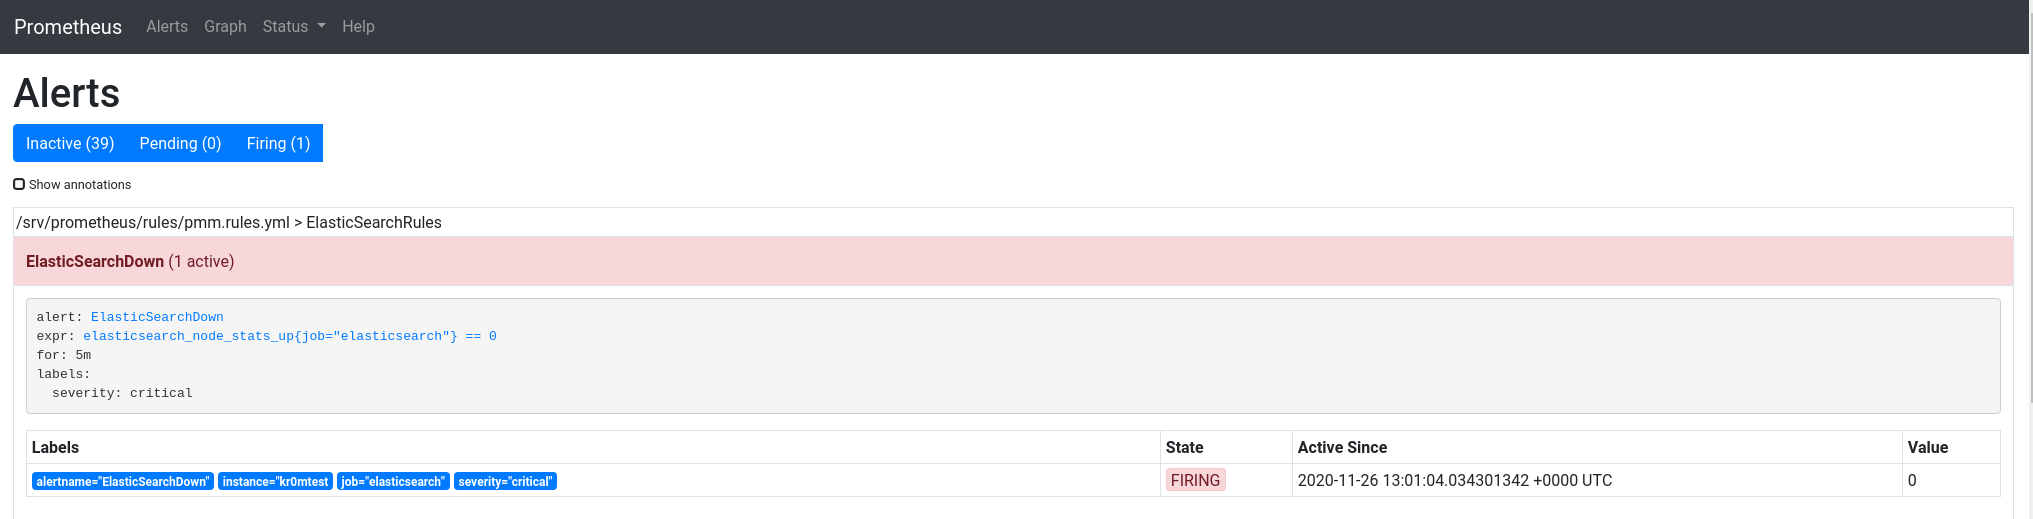
If we stop ElasticSearch, we can see the alarm:
If we have followed the guide on
Alertmanager
, we will see alerts like this in Telegram: