En este artículo vamos a aprender como monitorizar con PMM2 tanto una instancia de ElasticSearch como un cluster, de este modo recibiremos alarmas ante cualquier posible problema con nuestra base de datos. El artículo describe como monitorizar el servicio mediante PMM2, configurar las alertas de Alertmanager y como visualizar las métricas mediante Grafana.
Vamos a utilizar el exporter oficial de la
web de Prometheus
:
https://github.com/justwatchcom/elasticsearch_exporter
Para compilar el exporter será necesario Git y Go:
Compilamos el exporter:
export GOPATH=/root/go
export GOPATH=$(go env GOPATH)
go get -u github.com/justwatchcom/elasticsearch_exporter
cd /root/go/bin/
Comprobamos la existencia del binario:
-rwxr-xr-x 1 root root 12229816 nov 25 15:39 elasticsearch_exporter
Bindeamos el exporter a la loopback ya que vamos a montar un Nginx por delante para que pida credenciales:
nohup /root/go/bin/elasticsearch_exporter --web.listen-address="127.0.0.1:9114" &
Asignamos los permisos necesarios y arrancamos el servicio:
/etc/local.d/elasticsearch_exporter.start
Comprobamos que se haya bindeado a la ip correcta:
tcp 0 0 127.0.0.1:9114 0.0.0.0:* LISTEN 7751/elasticsearch_
Si nuestra configuración requiere algún parámetro especial porque el servicio de ElasticSearch está bindeado a otra ip, requiere user/pass o cualquier otra peculiaridad debemos indicarlo mediante el parámetro oportuno, ejecutando el exporter con el parámetro –help nos mostrará la lista:
usage: elasticsearch_exporter [<flags>]

Flags:
  -h, --help                 Show context-sensitive help (also try --help-long and --help-man).
      --web.listen-address=":9114"
                             Address to listen on for web interface and telemetry.
      --web.telemetry-path="/metrics"
                             Path under which to expose metrics.
      --es.uri="http://localhost:9200"
                             HTTP API address of an Elasticsearch node.
      --es.timeout=5s        Timeout for trying to get stats from Elasticsearch.
      --es.all               Export stats for all nodes in the cluster. If used, this flag will override the flag es.node.
      --es.node="_local"     Node's name of which metrics should be exposed.
      --es.indices           Export stats for indices in the cluster.
      --es.indices_settings  Export stats for settings of all indices of the cluster.
      --es.cluster_settings  Export stats for cluster settings.
      --es.shards            Export stats for shards in the cluster (implies --es.indices).
      --es.snapshots         Export stats for the cluster snapshots.
      --es.clusterinfo.interval=5m
                             Cluster info update interval for the cluster label
      --es.ca=""             Path to PEM file that contains trusted Certificate Authorities for the Elasticsearch connection.
      --es.client-private-key=""
                             Path to PEM file that contains the private key for client auth when connecting to Elasticsearch.
      --es.client-cert=""    Path to PEM file that contains the corresponding cert for the private key to connect to Elasticsearch.
      --es.ssl-skip-verify   Skip SSL verification when connecting to Elasticsearch.
      --log.level="info"     Sets the loglevel. Valid levels are debug, info, warn, error
      --log.format="logfmt"  Sets the log format. Valid formats are json and logfmt
      --log.output="stdout"  Sets the log output. Valid outputs are stdout and stderr
      --version              Show application version.
Compilamos Nginx:
Configuramos Nginx para que pida password cuando la petición no provenga del servidor PMM:
...
server {
  listen SERVER_IP:9114;
  server_name _;

  location / {
      satisfy any;
      allow  PMM_SERVER_IP/32;
      auth_basic "Restricted Content";
      auth_basic_user_file /etc/nginx/.htpasswd;
      deny   all;

      proxy_pass http://127.0.0.1:9114;
  }
}
...
Generamos el fichero de passwords:
htpasswd -c /etc/nginx/.htpasswd admin
Reiniciamos Nginx:
Comprobamos que desde el servidor PMM no pida password:
Y que desde cualquier otro lugar si:
Configuramos el scrape de Prometheus:
scrape_configs:
- job_name: elasticsearch
  static_configs:
  - targets:
    - SERVER_IP:9114
  labels:
    service: elasticsearch
  relabel_configs:
  - source_labels: [__address__]
    regex: '(.*)\:9114'
    target_label:  'instance'
    replacement:   '$1'
  - source_labels: [__address__]
    regex: '(.*)\:9114'
    target_label:  'node_name'
    replacement:   '$1'
  - source_labels: [__address__]
    regex:         '.*\.(.*)\.lan.*'
    target_label:  'environment'
    replacement:   '$1'
Recargamos la configuración:
Para visualizar las métricas importamos el siguiente dashboard en Grafana:
https://grafana.com/grafana/dashboards/2322
NOTA: El dashboard que trae el exporter parece no mostrar muchas de las métricas, posiblemente por la versión de ElasticSearch?
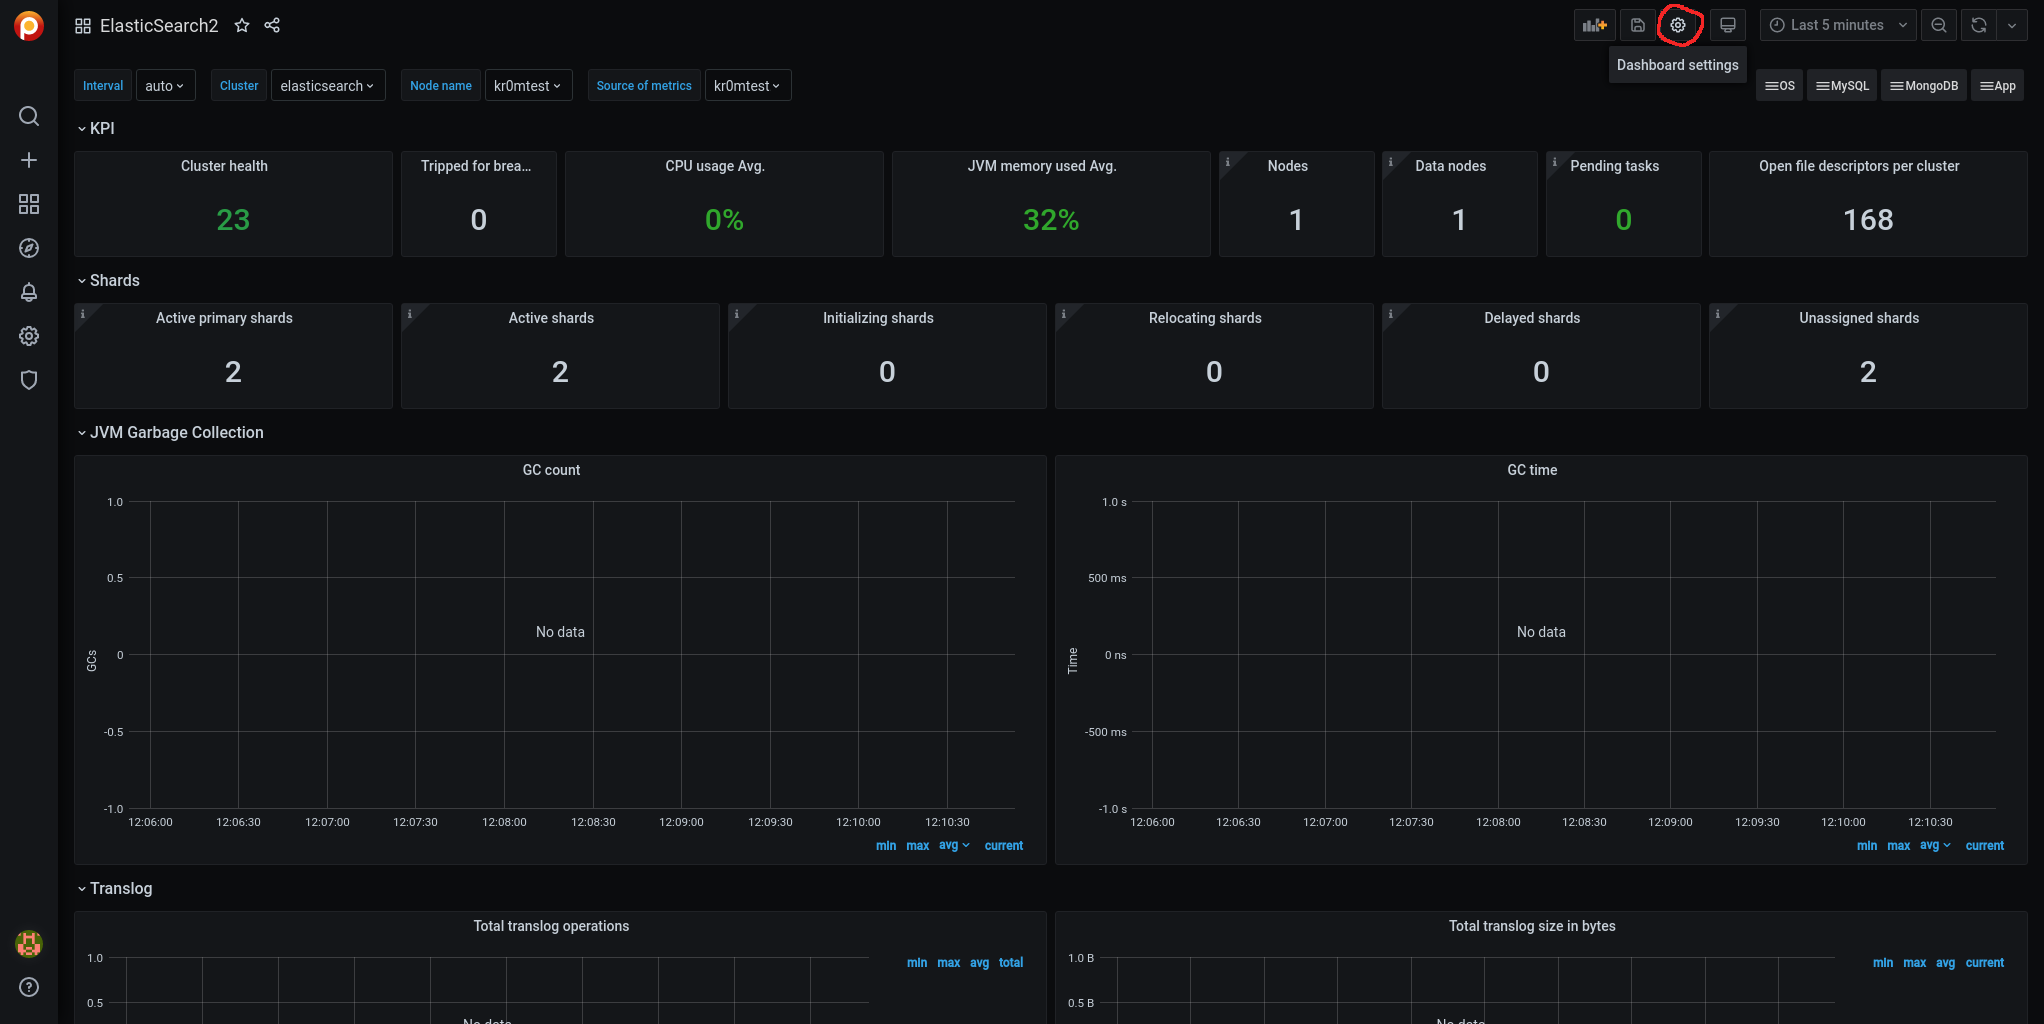
Hay algunas métricas que no aparecen cuando está seleccionada la variable Interval: Auto, modificamos la variable.
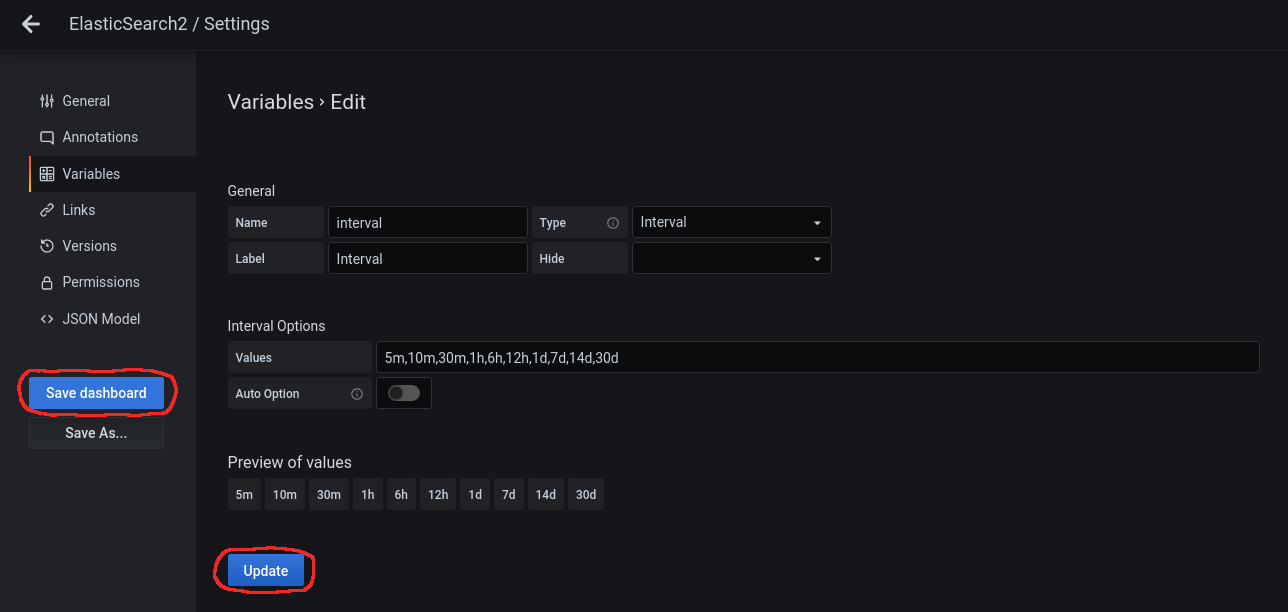
Accedemos a Dashboard Settings:
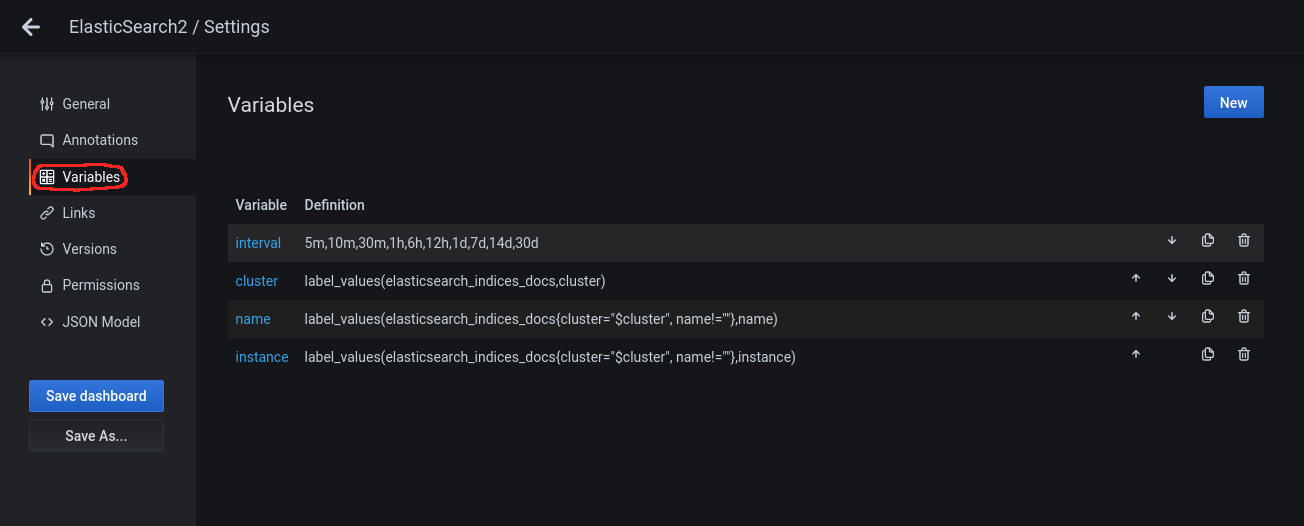
Accedemos al panel lateral Variables:
Clickamos encima de la variable para editarla y deshabilitamos en Interval Options el Auto Option:
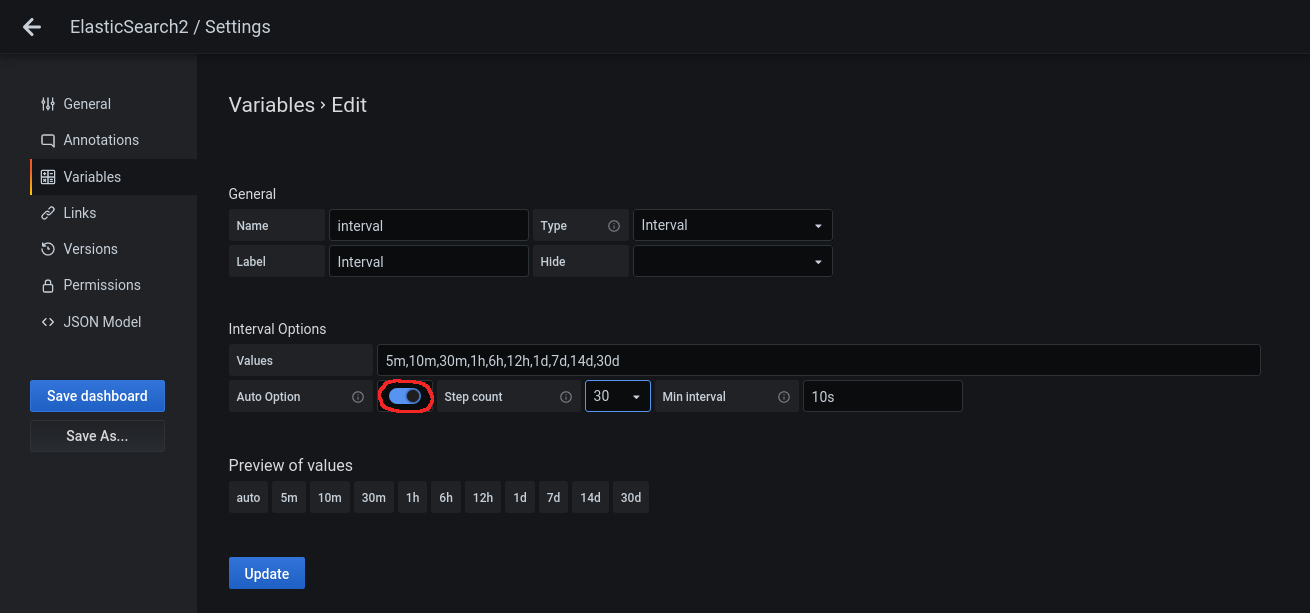
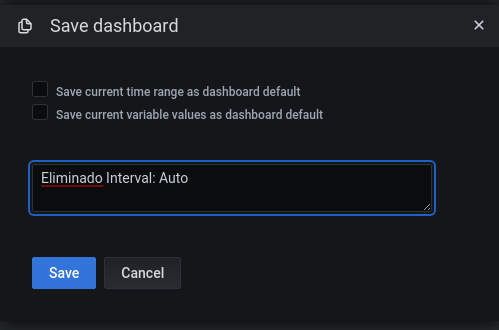
Le damos a Update y acto seguido a Save dashboard:
Nos pedirá un comentario:
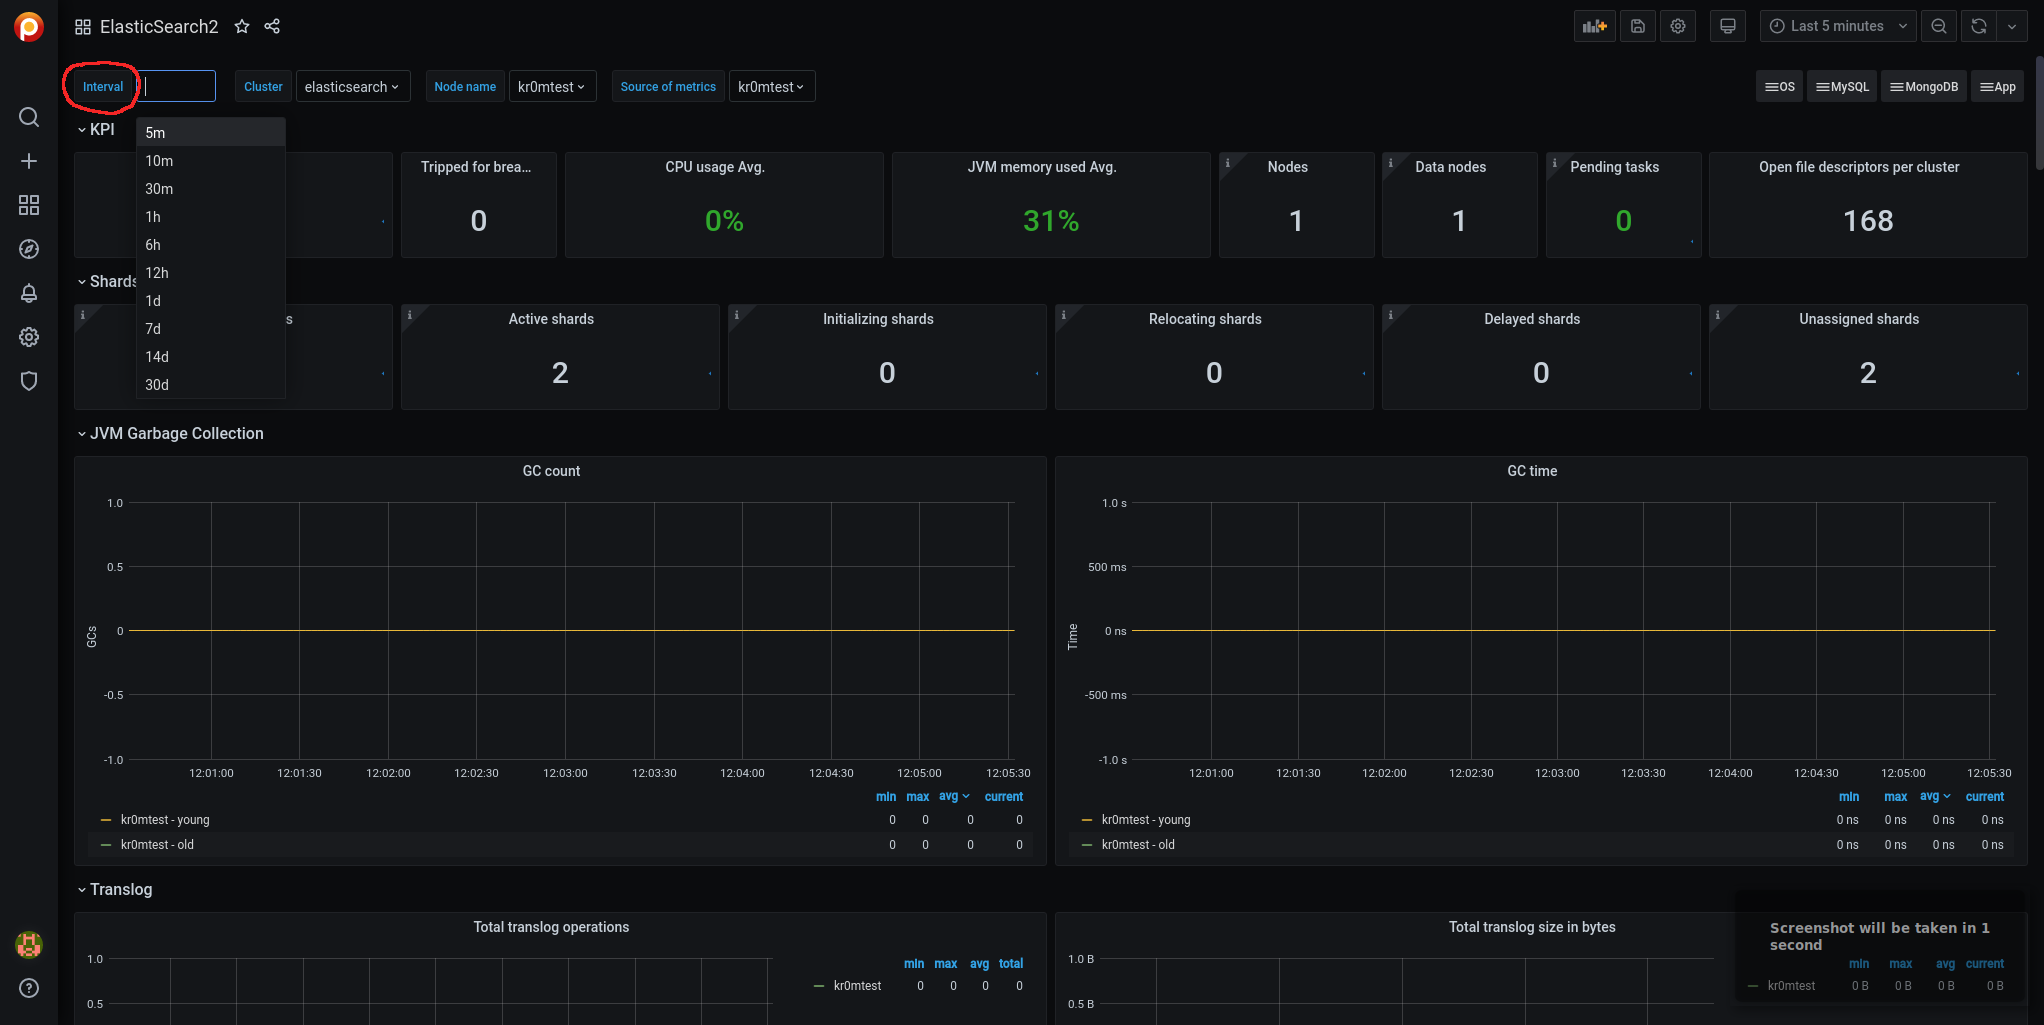
Volvemos atras mediante la flecha de arriba a la izquierda:

Ahora ya veremos los datos de muchas métricas que antes no y en el desplegable vemos que no aparece la opción Auto:
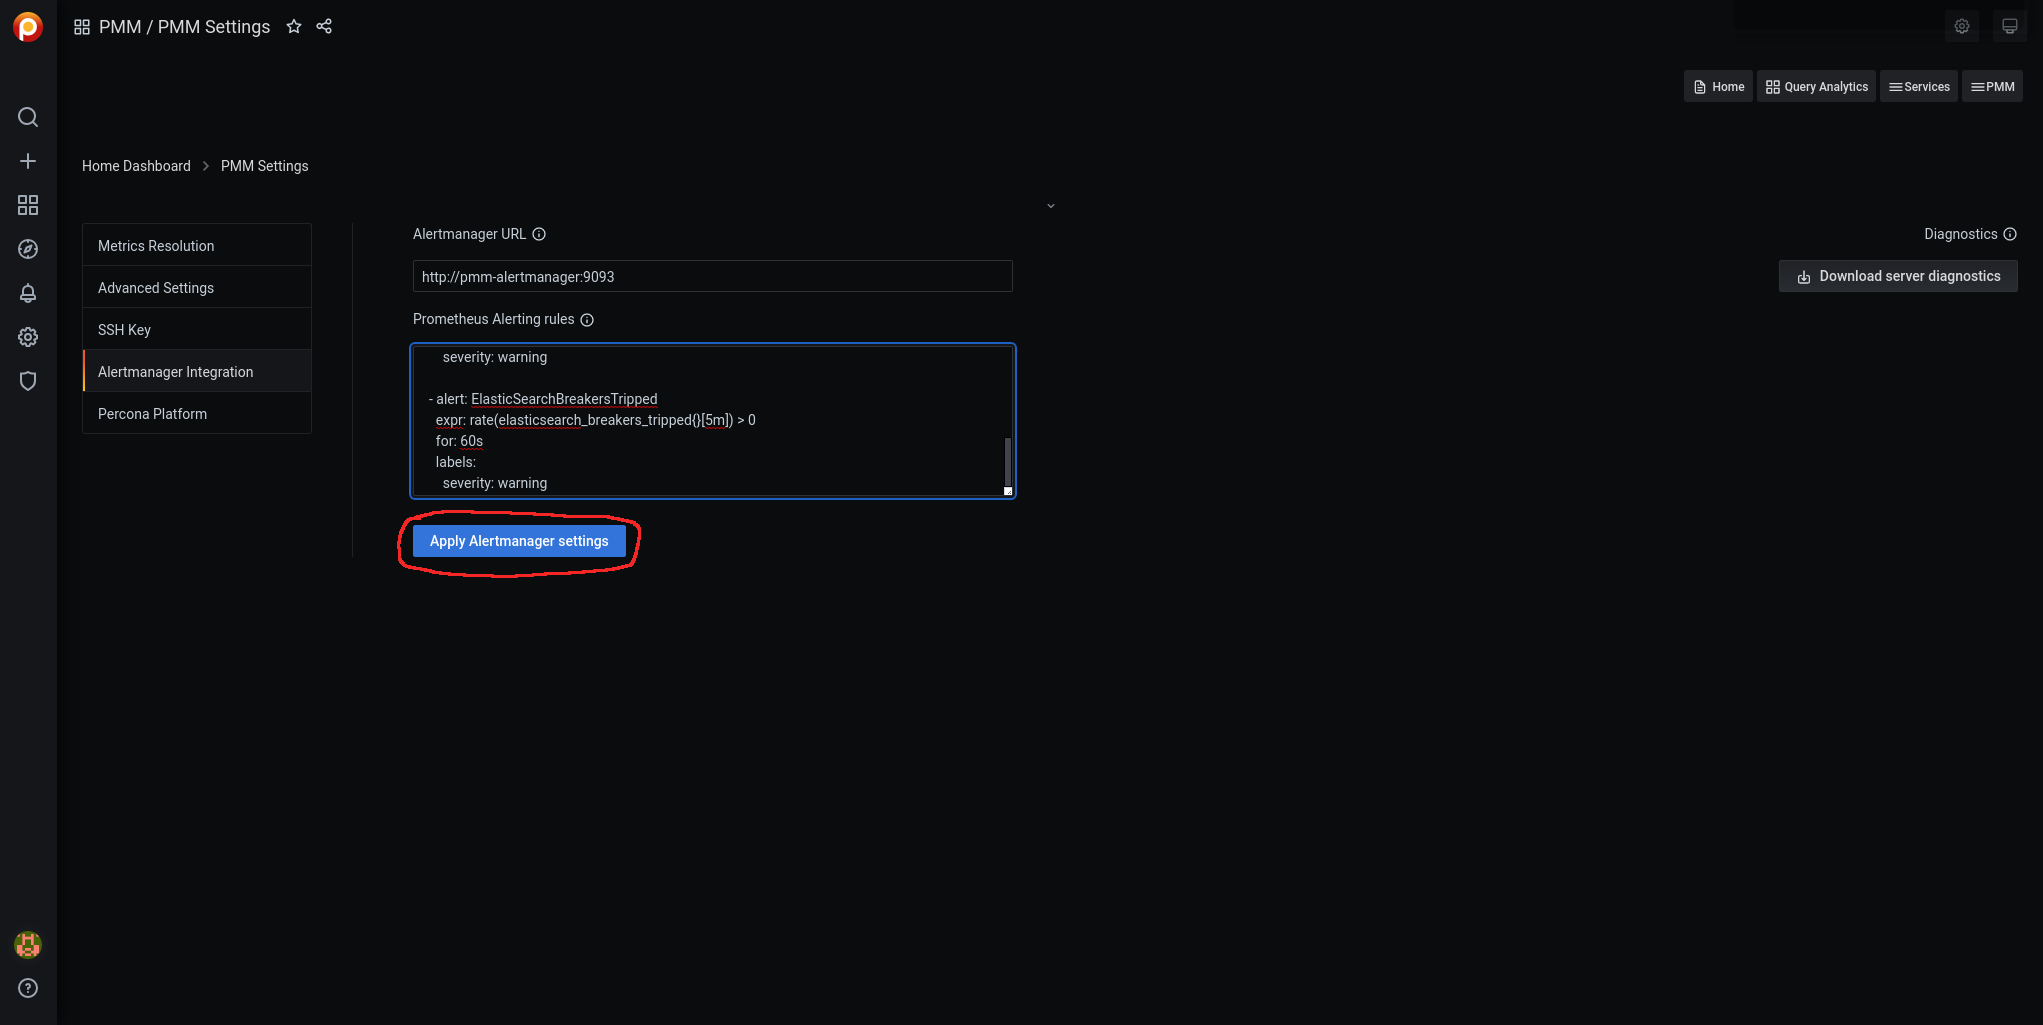
Para cargar las alarmas navegamos por Grafana hasta pmm-settings:

Accedemos a Alertmanager Integration:
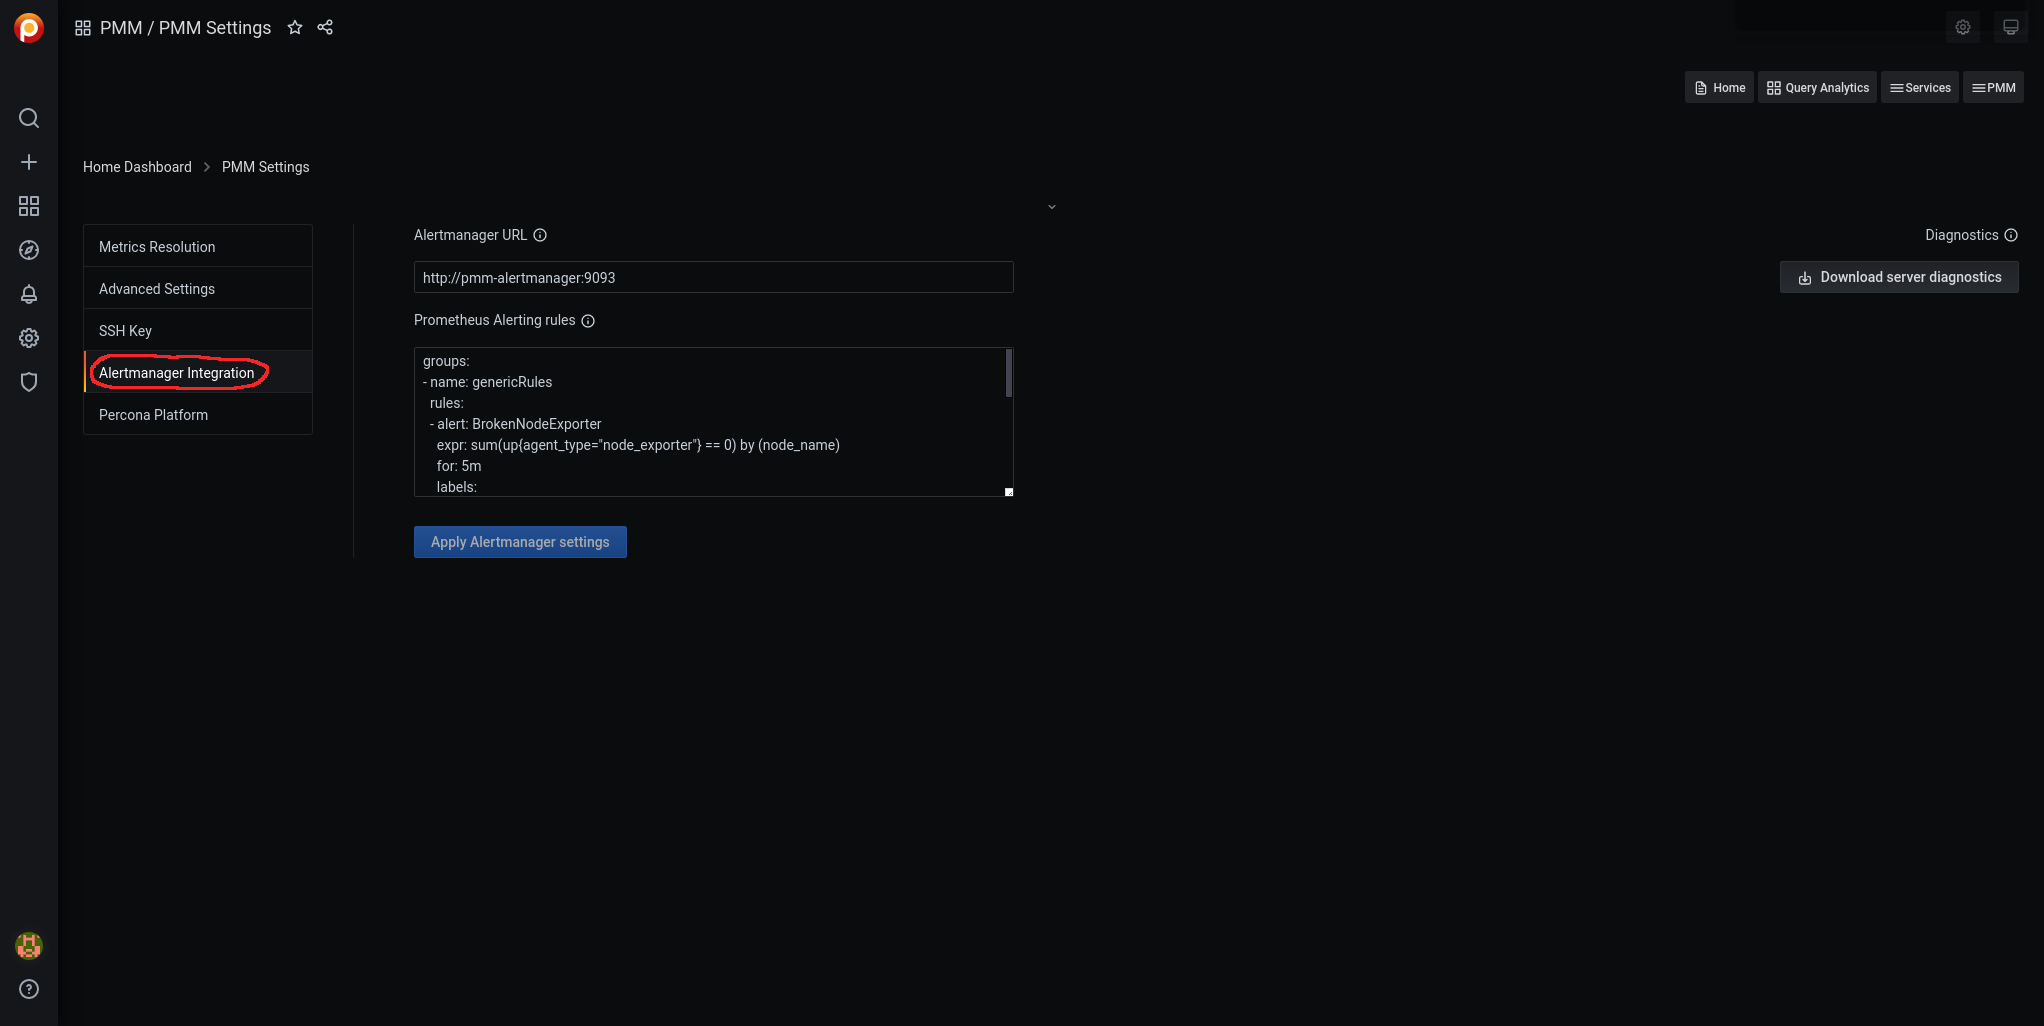
Editamos las reglas Prometheus Alerting rules:
- name: ElasticSearchRules
  rules:
  - alert: ElasticSearchExporterDown
    expr: up{job="elasticsearch"} == 0
    for: 5m
    labels:
      severity: critical

  - alert: ElasticSearchDown
    expr: elasticsearch_node_stats_up{job="elasticsearch"} == 0
    for: 5m
    labels:
      severity: critical

  - alert: ElasticSearchClusterHealthRED
    expr: elasticsearch_cluster_health_status{color="red"} == 1
    for: 5m
    labels:
      severity: critical

  - alert: ElasticSearchClusterHealthYellow
    expr: elasticsearch_cluster_health_status{color="yellow", cluster!="elasticsearch"} == 1
    for: 5m
    labels:
      severity: warning

  - alert: ElasticSearchJVMHeapTooHigh
    expr: elasticsearch_jvm_memory_used_bytes{area="heap"} / elasticsearch_jvm_memory_max_bytes{area="heap"} > 0.8
    for: 5m
    labels:
      severity: warning

  - alert: ElasticSearchTooFewNodesRunning
    expr: elasticsearch_cluster_health_number_of_nodes{cluster!="elasticsearch"} < 3
    for: 5m
    labels:
      severity: warning

  - alert: ElasticSearchCountOfJvmGcRuns
    expr: rate(elasticsearch_jvm_gc_collection_seconds_count{}[5m]) > 5
    for: 60s
    labels:
      severity: warning

  - alert: ElasticSearchGCRunTime
    expr: rate(elasticsearch_jvm_gc_collection_seconds_sum[5m]) > 0.3
    for: 60s
    labels:
      severity: warning

  - alert: ElasticSearchJsonParseFailures
    expr: elasticsearch_cluster_health_json_parse_failures > 0
    for: 60s
    labels:
      severity: warning

  - alert: ElasticSearchBreakersTripped
    expr: rate(elasticsearch_breakers_tripped{}[5m]) > 0
    for: 60s
    labels:
      severity: warning
NOTA: Las alertas sobre cluster no tienen en cuenta las instancias con cluster=“elasticsearch” ya que se trata del nombre del cluster cuando se instaló ElasticSearch en modo standalone.
Le damos a Apply Alertmanager settings:
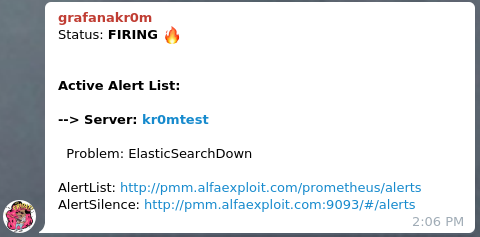
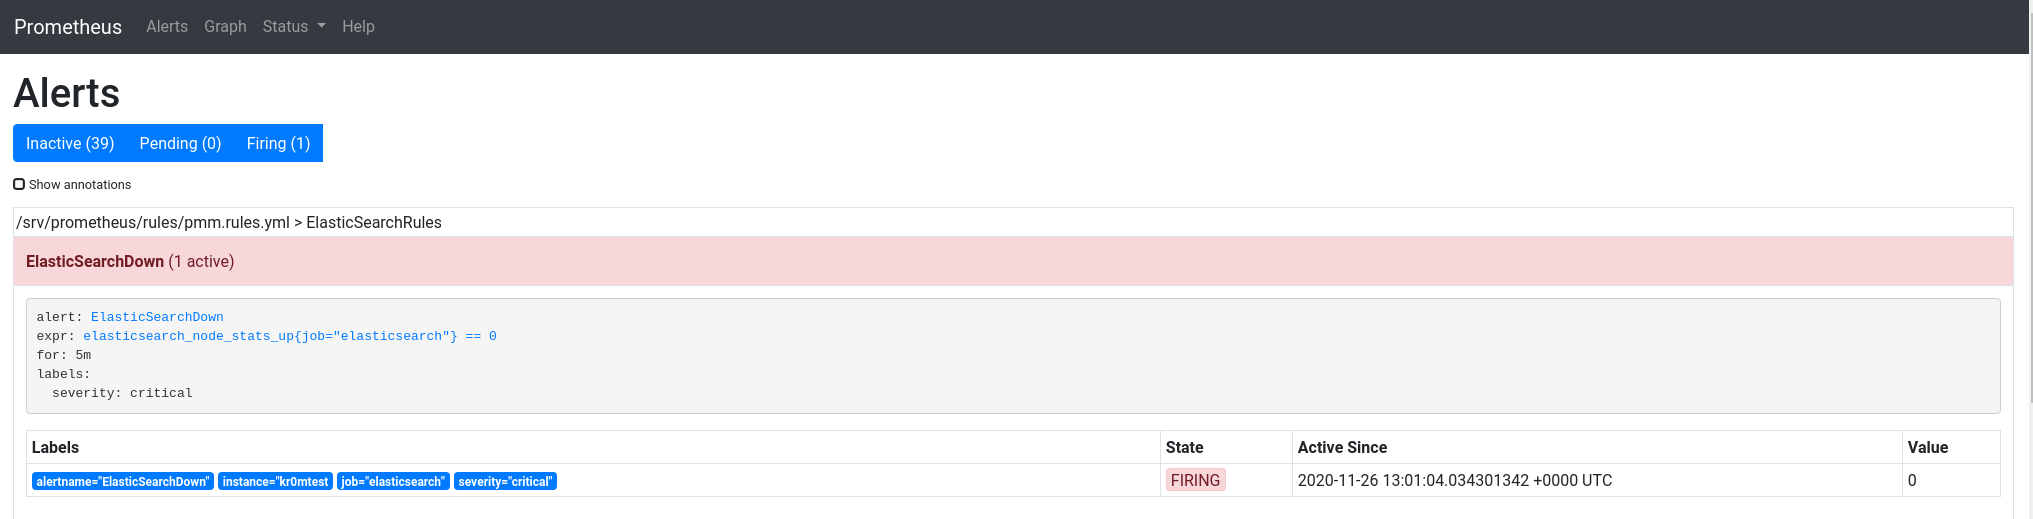
Si paramos el ElasticSearch podemos ver la alarma:
Si hemos seguido la guía sobre
Alertmanager
veremos en Telegram alertas como esta: