In this guide, we will see how to monitor sent/received emails and the queue status on a SendMail mail server using Prometheus. If we have not performed the basic installation of Prometheus first, we will follow the basic installation guide for Prometheus and Grafana.
The first step will be to enable the
SendMail stats:
cd /etc/mail
We generate the configuration file:
We edit it:
define(`STATUS_FILE',`/var/log/sendmail.stats')dnl
We compile the configuration and apply it:
cp HOSTNAME.cf sendmail.cf
We restart the service:
Now, with the following command, we can obtain the statistics:
Statistics from Tue Jan  3 18:22:55 2023
 M   msgsfr  bytes_from   msgsto    bytes_to  msgsrej msgsdis msgsqur  Mailer
=====================================================================
 T        0          0K        0          0K        0       0       0
 C        0                    0                    0
If we send an email from the SendMail server, we will see the following output:
Statistics from Tue Jan  3 18:23:34 2023
 M   msgsfr  bytes_from   msgsto    bytes_to  msgsrej msgsdis msgsqur  Mailer
 3        1          1K        0          0K        0       0       0  local
 5        0          0K        1          2K        0       0       0  esmtp
=====================================================================
 T        1          1K        1          2K        0       0       0
 C        1                    1                    0
We observe that the email is generated from local(msgsfr) to esmtp(msgsto)
If we receive an email on the SendMail server, we will see the following output:
Statistics from Tue Jan  3 18:23:34 2023
 M   msgsfr  bytes_from   msgsto    bytes_to  msgsrej msgsdis msgsqur  Mailer
 3        1          1K        1          5K        0       0       0  local
 5        1          4K        1          2K        0       0       0  esmtp
=====================================================================
 T        2          5K        2          7K        0       0       0
 C        2                    2                    0
We observe that the email is generated from esmtp(msgsfr) to local(msgsto)
The last two rows are the Totals: T, which in my opinion, having the partials, does not make sense to show, and the messages sent over TCP connections, which I also do not see the point of.
- connectionMessagesFrom: Number of messages sent over TCP connections.
- connectionMessagesTo: Number of messages received over TCP connections.
- connectionMessagesRejected: Number of messages that arrived over TCP connections and were rejected.
Therefore, to monitor sent emails and incoming/outgoing traffic, we must obtain the following fields.
- Issuance:
Increase esmtp(msgsto)
Increase esmtp(bytes_to)
- Reception:
Increase local(msgsto)
Increase local(bytes_to)
Another interesting metric is the SMTP server queue size. Observing a queued email in an idle system is complicated, so we will define a firewall rule where we will allow the entry of the email but not the exit. This way, the email will be queued:
ipfw add 00011 deny tcp from any to any 25
We check the queue:
		/var/spool/mqueue (1 request)
-----Q-ID----- --Size-- -----Q-Time----- ------------Sender/Recipient-----------
19DAkLMh052596      575 Tue Jan 03 18:46 <kr0m@alfaexploit.com>
                 (Deferred: Permission denied)
					 <jjivarspoquet@gmail.com>
		Total requests: 1
We delete the firewall rule and see that there are no more queued emails:
ipfw delete 00011
/var/spool/mqueue is empty
		Total requests: 0
Sendmail processes emails in different queues depending on their origin. The default queues are:
- mqueue queue: The email was introduced into the system by a process running as root. These are usually incoming emails, and we can find them in /var/spool/mqueue/.
- clientmqueue queue: The email was introduced into the system by any user other than root. These are usually emails sent by regular system users, and we can find them in /var/spool/clientmqueue (path defined in /etc/mail/submit.cf).
NOTE: I have not been able to queue emails in the clientmqueue queue in any way. I do not know in what case this scenario will occur.
In addition, each of the queues may have emails in different states:
- lost: These are emails that, after several attempts, could not be delivered for some reason.
- quarantined: These are emails that, for some reason, have been quarantined. This can happen due to a rule defined at the SendMail level or by a milter such as SpamAssassin, for example.
Mailq allows us to visualize the different queues and states according to the arguments we pass to it:
- Without arguments: Shows the mqueue queue.
- -Ac: Shows the clientmqueue queue.
- -qL: Shows the lost emails.
- -qQ: Shows the quarantined emails.
Now that we already know how to query the data manually, we are going to proceed with programming our exporter. The first step is to decide what type of metrics we are going to expose. In my case, they will all be Gauges:
- Emails sent/received
- Bytes sent/received
- Queued emails by queue/status
We compile the exporter:
cd sendmailExporter
go mod init sendmailExporter
package main
import (
	"bufio"
	"bytes"
	"fmt"
	"net"
	"net/http"
	"os/exec"
	"regexp"
	"strconv"
	"strings"
	"time"
	"github.com/prometheus/client_golang/prometheus"
	"github.com/prometheus/client_golang/prometheus/promhttp"
)
var (
	// Metric definitions
	smtpIncomingEmails = prometheus.NewGauge(prometheus.GaugeOpts{
		Name: "smtp_incoming_emails", Help: "Incoming emails via SMTP: mailstats",
	})
	smtpIncomingData = prometheus.NewGauge(prometheus.GaugeOpts{
		Name: "smtp_incoming_data", Help: "Incoming Kbytes via SMTP: mailstats",
	})
	smtpIncomingRejected = prometheus.NewGauge(prometheus.GaugeOpts{
		Name: "smtp_incoming_rejected_emails", Help: "Rejected incoming emails via SMTP: mailstats",
	})
	smtpIncomingDiscarded = prometheus.NewGauge(prometheus.GaugeOpts{
		Name: "smtp_incoming_discarded_emails", Help: "Discarded incoming emails via SMTP: mailstats",
	})
	smtpIncomingQuarantined = prometheus.NewGauge(prometheus.GaugeOpts{
		Name: "smtp_incoming_quarantined_emails", Help: "Quarantined incoming emails via SMTP: mailstats",
	})
	smtpOutcomingEmails = prometheus.NewGauge(prometheus.GaugeOpts{
		Name: "smtp_outcoming_emails", Help: "outcoming emails via SMTP: mailstats",
	})
	smtpOutcomingData = prometheus.NewGauge(prometheus.GaugeOpts{
		Name: "smtp_outcoming_data", Help: "outcoming Kbytes via SMTP: mailstats",
	})
	smtpOutcomingRejected = prometheus.NewGauge(prometheus.GaugeOpts{
		Name: "smtp_outcoming_rejected_emails", Help: "Rejected outcoming emails via SMTP: mailstats",
	})
	smtpOutcomingDiscarded = prometheus.NewGauge(prometheus.GaugeOpts{
		Name: "smtp_outcoming_discarded_emails", Help: "Discarded outcoming emails via SMTP: mailstats",
	})
	smtpOutcomingQuarantined = prometheus.NewGauge(prometheus.GaugeOpts{
		Name: "smtp_outcoming_quarantined_emails", Help: "Quarantined outcoming emails via SMTP: mailstats",
	})
	smtpQueuedMqueue = prometheus.NewGauge(prometheus.GaugeOpts{
		Name: "smtp_queued_emails_mqueue", Help: "Queued emails: qmail",
	})
	smtpQueuedClient = prometheus.NewGauge(prometheus.GaugeOpts{
		Name: "smtp_queued_emails_clientmqueue", Help: "Queued emails: qmail -Ac",
	})
	smtpQueuedLost = prometheus.NewGauge(prometheus.GaugeOpts{
		Name: "smtp_queued_emails_lost", Help: "Queued emails: qmail -qL",
	})
	smtpQueuedQuarantined = prometheus.NewGauge(prometheus.GaugeOpts{
		Name: "smtp_queued_emails_quarantined", Help: "Queued emails: qmail -qQ",
	})
)
func init() {
	// Register metrics with Prometheus registry
	prometheus.MustRegister(smtpIncomingEmails)
	prometheus.MustRegister(smtpIncomingData)
	prometheus.MustRegister(smtpIncomingRejected)
	prometheus.MustRegister(smtpIncomingDiscarded)
	prometheus.MustRegister(smtpIncomingQuarantined)
	prometheus.MustRegister(smtpOutcomingEmails)
	prometheus.MustRegister(smtpOutcomingData)
	prometheus.MustRegister(smtpOutcomingRejected)
	prometheus.MustRegister(smtpOutcomingDiscarded)
	prometheus.MustRegister(smtpOutcomingQuarantined)
	prometheus.MustRegister(smtpQueuedMqueue)
	prometheus.MustRegister(smtpQueuedClient)
	prometheus.MustRegister(smtpQueuedLost)
	prometheus.MustRegister(smtpQueuedQuarantined)
}
// Helper to run mailq commands and parse the 'Total requests' field
func getMailqCount(args ...string) float64 {
	cmd := exec.Command("mailq", args...)
	out, err := cmd.Output()
	if err != nil {
		return 0
	}
	re := regexp.MustCompile(`.*Total requests:\s*(\d*)`)
	scanner := bufio.NewScanner(bytes.NewReader(out))
	for scanner.Scan() {
		match := re.FindStringSubmatch(scanner.Text())
		if len(match) > 1 {
			val, _ := strconv.ParseFloat(match[1], 64)
			return val
		}
	}
	return 0
}
func getSendmailStats() {
	fmt.Println("++ mainThread started")
	fmt.Println("------------------")
	// Pre-compile regex for matching mailstats output
	reLocal := regexp.MustCompile(`\s*\d*\s*\d*\s*\d*\s*(\d*)\s*(\d*)\s*(\d*)\s*(\d*)\s*(\d*)\s*local`)
	reEsmtp := regexp.MustCompile(`\s*\d*\s*\d*\s*\d*\s*(\d*)\s*(\d*)\s*(\d*)\s*(\d*)\s*(\d*)\s*esmtp`)
	for {
		now := time.Now().Format("2006-01-02 15:04:05.000000")
		fmt.Printf("%s\n\n", now)
		// 1. MAILSTATS collection
		cmd := exec.Command("mailstats", "-P")
		out, err := cmd.Output()
		if err == nil {
			lines := strings.Split(string(out), "\n")
			for _, line := range lines {
				// Parse local (Incoming) stats
				if match := reLocal.FindStringSubmatch(line); len(match) > 5 {
					v1, _ := strconv.ParseFloat(match[1], 64)
					v2, _ := strconv.ParseFloat(match[2], 64)
					v3, _ := strconv.ParseFloat(match[3], 64)
					v4, _ := strconv.ParseFloat(match[4], 64)
					v5, _ := strconv.ParseFloat(match[5], 64)
					fmt.Printf("> smtp_incoming_emails: %v\n", v1)
					smtpIncomingEmails.Set(v1)
					fmt.Printf("> smtp_incoming_data: %v\n", v2)
					smtpIncomingData.Set(v2)
					fmt.Printf("> smtp_incoming_rejected_emails: %v\n", v3)
					smtpIncomingRejected.Set(v3)
					fmt.Printf("> smtp_incoming_discarded_emails: %v\n", v4)
					smtpIncomingDiscarded.Set(v4)
					fmt.Printf("> smtp_incoming_quarantined_emails: %v\n\n", v5)
					smtpIncomingQuarantined.Set(v5)
				}
				// Parse esmtp (Outgoing) stats
				if match := reEsmtp.FindStringSubmatch(line); len(match) > 5 {
					v1, _ := strconv.ParseFloat(match[1], 64)
					v2, _ := strconv.ParseFloat(match[2], 64)
					v3, _ := strconv.ParseFloat(match[3], 64)
					v4, _ := strconv.ParseFloat(match[4], 64)
					v5, _ := strconv.ParseFloat(match[5], 64)
					fmt.Printf("> smtp_outcoming_emails: %v\n", v1)
					smtpOutcomingEmails.Set(v1)
					fmt.Printf("> smtp_outcoming_data: %v\n", v2)
					smtpOutcomingData.Set(v2)
					fmt.Printf("> smtp_outcoming_rejected_emails: %v\n", v3)
					smtpOutcomingRejected.Set(v3)
					fmt.Printf("> smtp_outcoming_discarded_emails: %v\n", v4)
					smtpOutcomingDiscarded.Set(v4)
					fmt.Printf("> smtp_outcoming_quarantined_emails: %v\n\n", v5)
					smtpOutcomingQuarantined.Set(v5)
				}
			}
		}
		// 2. Collection from various MAILQ commands
		q1 := getMailqCount()
		fmt.Printf("> smtp_queued_emails_mqueue: %v\n", q1)
		smtpQueuedMqueue.Set(q1)
		q2 := getMailqCount("-Ac")
		fmt.Printf("> smtp_queued_emails_clientmqueue: %v\n", q2)
		smtpQueuedClient.Set(q2)
		q3 := getMailqCount("-qL")
		fmt.Printf("> smtp_queued_emails_lost: %v\n", q3)
		smtpQueuedLost.Set(q3)
		q4 := getMailqCount("-qQ")
		fmt.Printf("> smtp_queued_emails_quarantined: %v\n", q4)
		smtpQueuedQuarantined.Set(q4)
		fmt.Println("------------------")
		time.Sleep(30 * time.Second)
	}
}
// basicAuth Middleware for protecting the /metrics endpoint
func basicAuth(next http.Handler) http.Handler {
	return http.HandlerFunc(func(w http.ResponseWriter, r *http.Request) {
		user, pass, ok := r.BasicAuth()
		if !ok || user != "sendmail_exporter_user" || pass != "XXXXXXXXXXXXXXXXXXX" {
			w.Header().Set("WWW-Authenticate", `Basic realm="metrics"`)
			w.WriteHeader(http.StatusUnauthorized)
			w.Write([]byte("401 Unauthorized\n"))
			return
		}
		// Console logging for request tracking
		now := time.Now().Format("2006-01-02 15:04:05.000000")
		srcIP, _, _ := net.SplitHostPort(r.RemoteAddr)
		fmt.Printf("\n< Serving metrics: %s - %s\n\n", srcIP, now)
		next.ServeHTTP(w, r)
	})
}
func main() {
	// Start background metric collection goroutine
	go getSendmailStats()
	// Configure HTTP routes
	mux := http.NewServeMux()
	mux.Handle("/metrics", basicAuth(promhttp.Handler()))
	fmt.Println("Server listening on 0.0.0.0:2525")
	if err := http.ListenAndServe(":2525", mux); err != nil {
		fmt.Printf("Fatal error: %v\n", err)
	}
}
NOTE: Remember that if we install the exporter on the parent host of a jail server, we must bind it only to its specific IP address. Otherwise, it will take over the IPs of all the jails.
We compile and copy the binary to the system:
cp sendmailExporter /usr/local/bin/
We run it manually to make sure it does not fail:
We query the metrics manually:
# HELP go_gc_duration_seconds A summary of the wall-time pause (stop-the-world) duration in garbage collection cycles.
# TYPE go_gc_duration_seconds summary
go_gc_duration_seconds{quantile="0"} 0.000335967
go_gc_duration_seconds{quantile="0.25"} 0.000375586
go_gc_duration_seconds{quantile="0.5"} 0.000399737
go_gc_duration_seconds{quantile="0.75"} 0.000420252
go_gc_duration_seconds{quantile="1"} 0.001975418
go_gc_duration_seconds_sum 0.178386612
go_gc_duration_seconds_count 426
# HELP go_gc_gogc_percent Heap size target percentage configured by the user, otherwise 100. This value is set by the GOGC environment variable, and the runtime/debug.SetGCPercent function. Sourced from /gc/gogc:percent.
# TYPE go_gc_gogc_percent gauge
go_gc_gogc_percent 100
# HELP go_gc_gomemlimit_bytes Go runtime memory limit configured by the user, otherwise math.MaxInt64. This value is set by the GOMEMLIMIT environment variable, and the runtime/debug.SetMemoryLimit function. Sourced from /gc/gomemlimit:bytes.
# TYPE go_gc_gomemlimit_bytes gauge
go_gc_gomemlimit_bytes 9.223372036854776e+18
# HELP go_goroutines Number of goroutines that currently exist.
# TYPE go_goroutines gauge
go_goroutines 8
# HELP go_info Information about the Go environment.
# TYPE go_info gauge
go_info{version="go1.24.13"} 1
# HELP go_memstats_alloc_bytes Number of bytes allocated in heap and currently in use. Equals to /memory/classes/heap/objects:bytes.
# TYPE go_memstats_alloc_bytes gauge
go_memstats_alloc_bytes 3.039864e+06
# HELP go_memstats_alloc_bytes_total Total number of bytes allocated in heap until now, even if released already. Equals to /gc/heap/allocs:bytes.
# TYPE go_memstats_alloc_bytes_total counter
go_memstats_alloc_bytes_total 5.9623328e+08
# HELP go_memstats_buck_hash_sys_bytes Number of bytes used by the profiling bucket hash table. Equals to /memory/classes/profiling/buckets:bytes.
# TYPE go_memstats_buck_hash_sys_bytes gauge
go_memstats_buck_hash_sys_bytes 3666
# HELP go_memstats_frees_total Total number of heap objects frees. Equals to /gc/heap/frees:objects + /gc/heap/tiny/allocs:objects.
# TYPE go_memstats_frees_total counter
go_memstats_frees_total 1.990489e+06
# HELP go_memstats_gc_sys_bytes Number of bytes used for garbage collection system metadata. Equals to /memory/classes/metadata/other:bytes.
# TYPE go_memstats_gc_sys_bytes gauge
go_memstats_gc_sys_bytes 2.641416e+06
# HELP go_memstats_heap_alloc_bytes Number of heap bytes allocated and currently in use, same as go_memstats_alloc_bytes. Equals to /memory/classes/heap/objects:bytes.
# TYPE go_memstats_heap_alloc_bytes gauge
go_memstats_heap_alloc_bytes 3.039864e+06
# HELP go_memstats_heap_idle_bytes Number of heap bytes waiting to be used. Equals to /memory/classes/heap/released:bytes + /memory/classes/heap/free:bytes.
# TYPE go_memstats_heap_idle_bytes gauge
go_memstats_heap_idle_bytes 3.52256e+06
# HELP go_memstats_heap_inuse_bytes Number of heap bytes that are in use. Equals to /memory/classes/heap/objects:bytes + /memory/classes/heap/unused:bytes
# TYPE go_memstats_heap_inuse_bytes gauge
go_memstats_heap_inuse_bytes 4.276224e+06
# HELP go_memstats_heap_objects Number of currently allocated objects. Equals to /gc/heap/objects:objects.
# TYPE go_memstats_heap_objects gauge
go_memstats_heap_objects 2884
# HELP go_memstats_heap_released_bytes Number of heap bytes released to OS. Equals to /memory/classes/heap/released:bytes.
# TYPE go_memstats_heap_released_bytes gauge
go_memstats_heap_released_bytes 3.203072e+06
# HELP go_memstats_heap_sys_bytes Number of heap bytes obtained from system. Equals to /memory/classes/heap/objects:bytes + /memory/classes/heap/unused:bytes + /memory/classes/heap/released:bytes + /memory/classes/heap/free:bytes.
# TYPE go_memstats_heap_sys_bytes gauge
go_memstats_heap_sys_bytes 7.798784e+06
# HELP go_memstats_last_gc_time_seconds Number of seconds since 1970 of last garbage collection.
# TYPE go_memstats_last_gc_time_seconds gauge
go_memstats_last_gc_time_seconds 1.772358202308302e+09
# HELP go_memstats_mallocs_total Total number of heap objects allocated, both live and gc-ed. Semantically a counter version for go_memstats_heap_objects gauge. Equals to /gc/heap/allocs:objects + /gc/heap/tiny/allocs:objects.
# TYPE go_memstats_mallocs_total counter
go_memstats_mallocs_total 1.993373e+06
# HELP go_memstats_mcache_inuse_bytes Number of bytes in use by mcache structures. Equals to /memory/classes/metadata/mcache/inuse:bytes.
# TYPE go_memstats_mcache_inuse_bytes gauge
go_memstats_mcache_inuse_bytes 2416
# HELP go_memstats_mcache_sys_bytes Number of bytes used for mcache structures obtained from system. Equals to /memory/classes/metadata/mcache/inuse:bytes + /memory/classes/metadata/mcache/free:bytes.
# TYPE go_memstats_mcache_sys_bytes gauge
go_memstats_mcache_sys_bytes 15704
# HELP go_memstats_mspan_inuse_bytes Number of bytes in use by mspan structures. Equals to /memory/classes/metadata/mspan/inuse:bytes.
# TYPE go_memstats_mspan_inuse_bytes gauge
go_memstats_mspan_inuse_bytes 55040
# HELP go_memstats_mspan_sys_bytes Number of bytes used for mspan structures obtained from system. Equals to /memory/classes/metadata/mspan/inuse:bytes + /memory/classes/metadata/mspan/free:bytes.
# TYPE go_memstats_mspan_sys_bytes gauge
go_memstats_mspan_sys_bytes 65280
# HELP go_memstats_next_gc_bytes Number of heap bytes when next garbage collection will take place. Equals to /gc/heap/goal:bytes.
# TYPE go_memstats_next_gc_bytes gauge
go_memstats_next_gc_bytes 4.414354e+06
# HELP go_memstats_other_sys_bytes Number of bytes used for other system allocations. Equals to /memory/classes/other:bytes.
# TYPE go_memstats_other_sys_bytes gauge
go_memstats_other_sys_bytes 639838
# HELP go_memstats_stack_inuse_bytes Number of bytes obtained from system for stack allocator in non-CGO environments. Equals to /memory/classes/heap/stacks:bytes.
# TYPE go_memstats_stack_inuse_bytes gauge
go_memstats_stack_inuse_bytes 589824
# HELP go_memstats_stack_sys_bytes Number of bytes obtained from system for stack allocator. Equals to /memory/classes/heap/stacks:bytes + /memory/classes/os-stacks:bytes.
# TYPE go_memstats_stack_sys_bytes gauge
go_memstats_stack_sys_bytes 589824
# HELP go_memstats_sys_bytes Number of bytes obtained from system. Equals to /memory/classes/total:byte.
# TYPE go_memstats_sys_bytes gauge
go_memstats_sys_bytes 1.1754512e+07
# HELP go_sched_gomaxprocs_threads The current runtime.GOMAXPROCS setting, or the number of operating system threads that can execute user-level Go code simultaneously. Sourced from /sched/gomaxprocs:threads.
# TYPE go_sched_gomaxprocs_threads gauge
go_sched_gomaxprocs_threads 2
# HELP go_threads Number of OS threads created.
# TYPE go_threads gauge
go_threads 7
# HELP promhttp_metric_handler_requests_in_flight Current number of scrapes being served.
# TYPE promhttp_metric_handler_requests_in_flight gauge
promhttp_metric_handler_requests_in_flight 1
# HELP promhttp_metric_handler_requests_total Total number of scrapes by HTTP status code.
# TYPE promhttp_metric_handler_requests_total counter
promhttp_metric_handler_requests_total{code="200"} 1660
promhttp_metric_handler_requests_total{code="500"} 0
promhttp_metric_handler_requests_total{code="503"} 0
# HELP smtp_incoming_data Incoming Kbytes via SMTP: mailstats
# TYPE smtp_incoming_data gauge
smtp_incoming_data 215794
# HELP smtp_incoming_discarded_emails Discarded incoming emails via SMTP: mailstats
# TYPE smtp_incoming_discarded_emails gauge
smtp_incoming_discarded_emails 0
# HELP smtp_incoming_emails Incoming emails via SMTP: mailstats
# TYPE smtp_incoming_emails gauge
smtp_incoming_emails 8488
# HELP smtp_incoming_quarantined_emails Quarantined incoming emails via SMTP: mailstats
# TYPE smtp_incoming_quarantined_emails gauge
smtp_incoming_quarantined_emails 0
# HELP smtp_incoming_rejected_emails Rejected incoming emails via SMTP: mailstats
# TYPE smtp_incoming_rejected_emails gauge
smtp_incoming_rejected_emails 855
# HELP smtp_outcoming_data outcoming Kbytes via SMTP: mailstats
# TYPE smtp_outcoming_data gauge
smtp_outcoming_data 33737
# HELP smtp_outcoming_discarded_emails Discarded outcoming emails via SMTP: mailstats
# TYPE smtp_outcoming_discarded_emails gauge
smtp_outcoming_discarded_emails 0
# HELP smtp_outcoming_emails outcoming emails via SMTP: mailstats
# TYPE smtp_outcoming_emails gauge
smtp_outcoming_emails 74
# HELP smtp_outcoming_quarantined_emails Quarantined outcoming emails via SMTP: mailstats
# TYPE smtp_outcoming_quarantined_emails gauge
smtp_outcoming_quarantined_emails 0
# HELP smtp_outcoming_rejected_emails Rejected outcoming emails via SMTP: mailstats
# TYPE smtp_outcoming_rejected_emails gauge
smtp_outcoming_rejected_emails 6045
# HELP smtp_queued_emails_clientmqueue Queued emails: qmail -Ac
# TYPE smtp_queued_emails_clientmqueue gauge
smtp_queued_emails_clientmqueue 0
# HELP smtp_queued_emails_lost Queued emails: qmail -qL
# TYPE smtp_queued_emails_lost gauge
smtp_queued_emails_lost 0
# HELP smtp_queued_emails_mqueue Queued emails: qmail
# TYPE smtp_queued_emails_mqueue gauge
smtp_queued_emails_mqueue 0
# HELP smtp_queued_emails_quarantined Queued emails: qmail -qQ
# TYPE smtp_queued_emails_quarantined gauge
smtp_queued_emails_quarantined 0
We daemonize the exporter:
#!/bin/sh
#
# PROVIDE: sendmailExporter
# REQUIRE: DAEMON
# KEYWORD: shutdown
. /etc/rc.subr
name="sendmailExporter"
rcvar="${name}_enable"
# Configuration
command="/usr/local/bin/sendmailExporter"
pidfile="/var/run/${name}.pid"
# Define commands
start_cmd="${name}_start"
stop_cmd="${name}_stop"
status_cmd="${name}_status"
sendmailExporter_start()
{
    if [ -f "${pidfile}" ] && kill -0 $(cat "${pidfile}") 2>/dev/null; then
        echo "${name} is already running."
    else
        echo "Starting ${name}..."
        # -f: daemonize and redirect output
        # -p: write child PID to file
        /usr/sbin/daemon -f -p ${pidfile} ${command}
    fi
}
sendmailExporter_stop()
{
    if [ -f "${pidfile}" ]; then
        echo "Stopping ${name}..."
        kill -s TERM $(cat "${pidfile}")
        # Wait for the process to exit
        sleep 2
        rm -f "${pidfile}"
        echo "Stopped."
    else
        echo "${name} is not running."
    fi
}
sendmailExporter_status()
{
    if [ -f "${pidfile}" ] && kill -0 $(cat "${pidfile}") 2>/dev/null; then
        echo "${name} is running with PID: $(cat ${pidfile})"
    else
        echo "${name} is not running."
        # Cleanup stale pidfile
        [ -f "${pidfile}" ] && rm -f "${pidfile}"
    fi
}
load_rc_config ${name}
run_rc_command "$1"
We assign the necessary permissions to our RC script:
We enable the service:
We start the exporter:
We check the metrics again to make sure it is still working:
We add the scrape configuration in Prometheus:
  - job_name: 'sendmail_exporter'
    scrape_interval: 30s
    static_configs:
      - targets:
        - hellstorm:2525
        labels:
          scrape_interval: 30s
    basic_auth:
      username: sendmail_exporter_user
      password: PASSWORD
NOTE: If we change the scrape interval, it is important to also update it in the scrape_interval label of the Grafana dashboards, since it is used in the dashboard queries.
We restart the service:
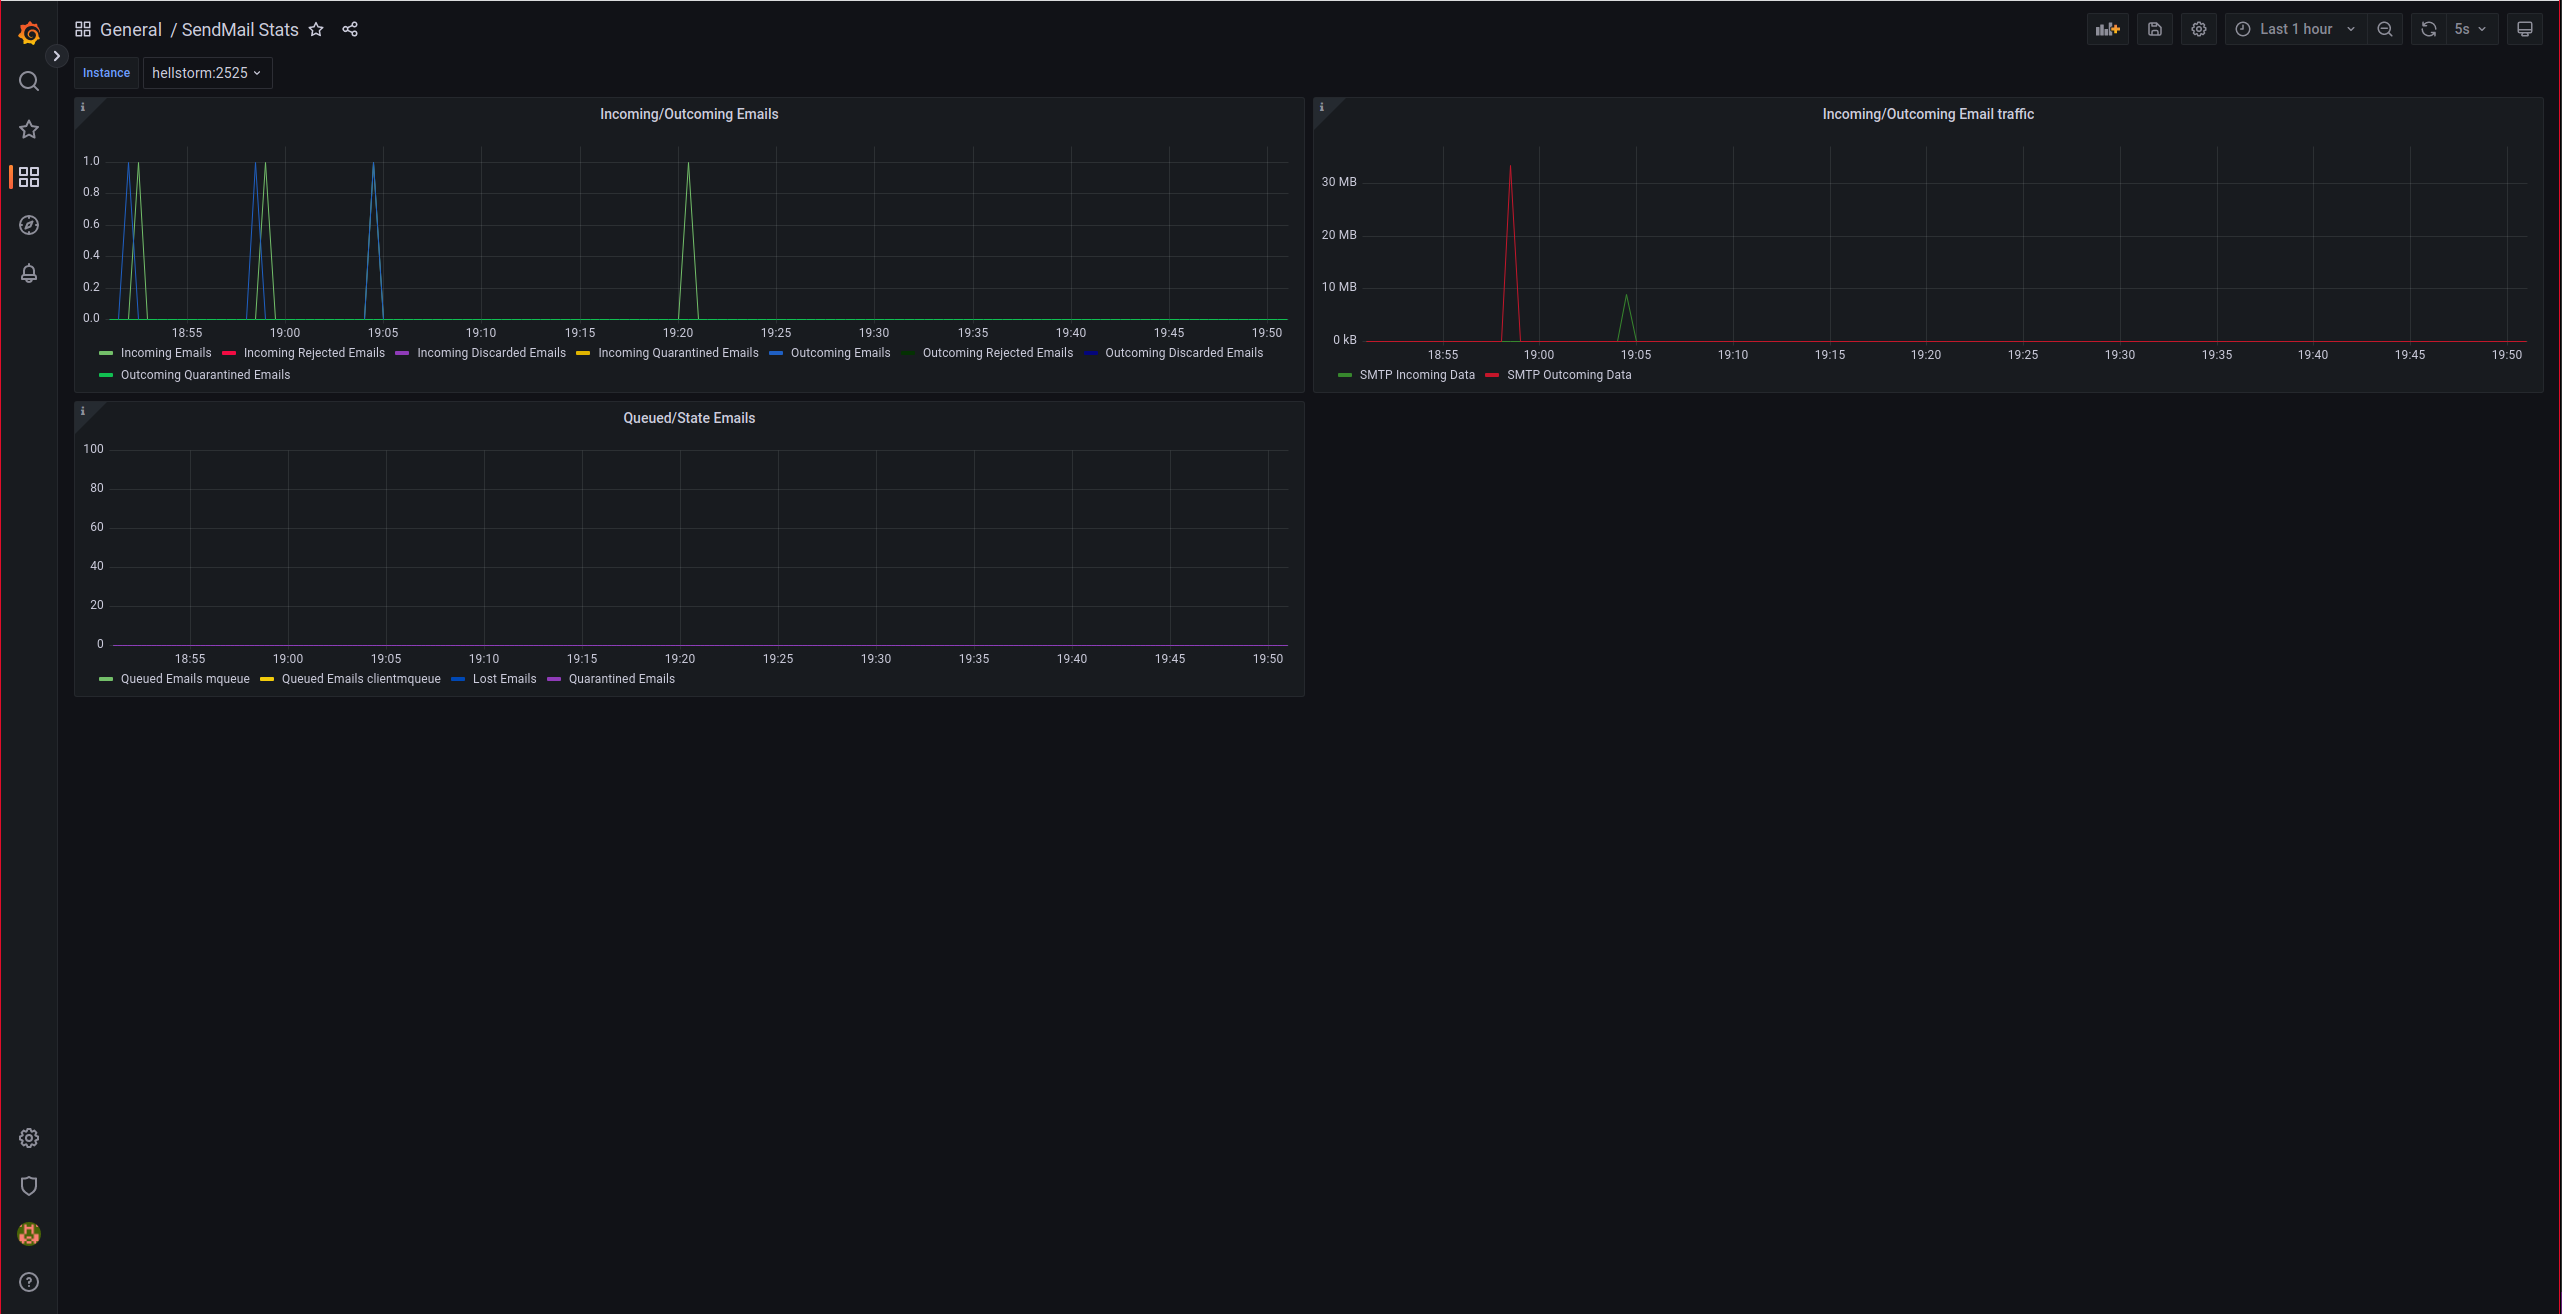
We import the following dashboard into Grafana
Where we will see the following graphs: