In this guide, we will see how to monitor a series of FreeBSD kernel parameters using Prometheus. If we have not installed Prometheus base first, we will follow the basic installation guide for Prometheus and Grafana.
Since version 12.0, FreeBSD comes with the prometheus_sysctl_exporter command that exposes kernel parameters in the form of metrics suitable for Prometheus. These metrics can be exposed in two ways.
Inetd
We enable the execution of prometheus_sysctl_exporter using
Inetd
:
# Example entry for the Prometheus sysctl metrics exporter
#
prom-sysctl	stream	tcp	nowait	nobody	/usr/sbin/prometheus_sysctl_exporter	prometheus_sysctl_exporter -dgh
We enable the service:
We start the service:
We check that the socket is listening:
root inetd 18095 6 tcp4 *:9124 *:* LISTEN
We leave a cmdwatch to see how Inetd starts the service on the fly when it receives a request:
Now we make a request from a web browser, a curl would not be valid since the command that Inetd executes is enabling compression and we would see a binary output on the console:
http://192.168.69.2:9124
We will see the following output:
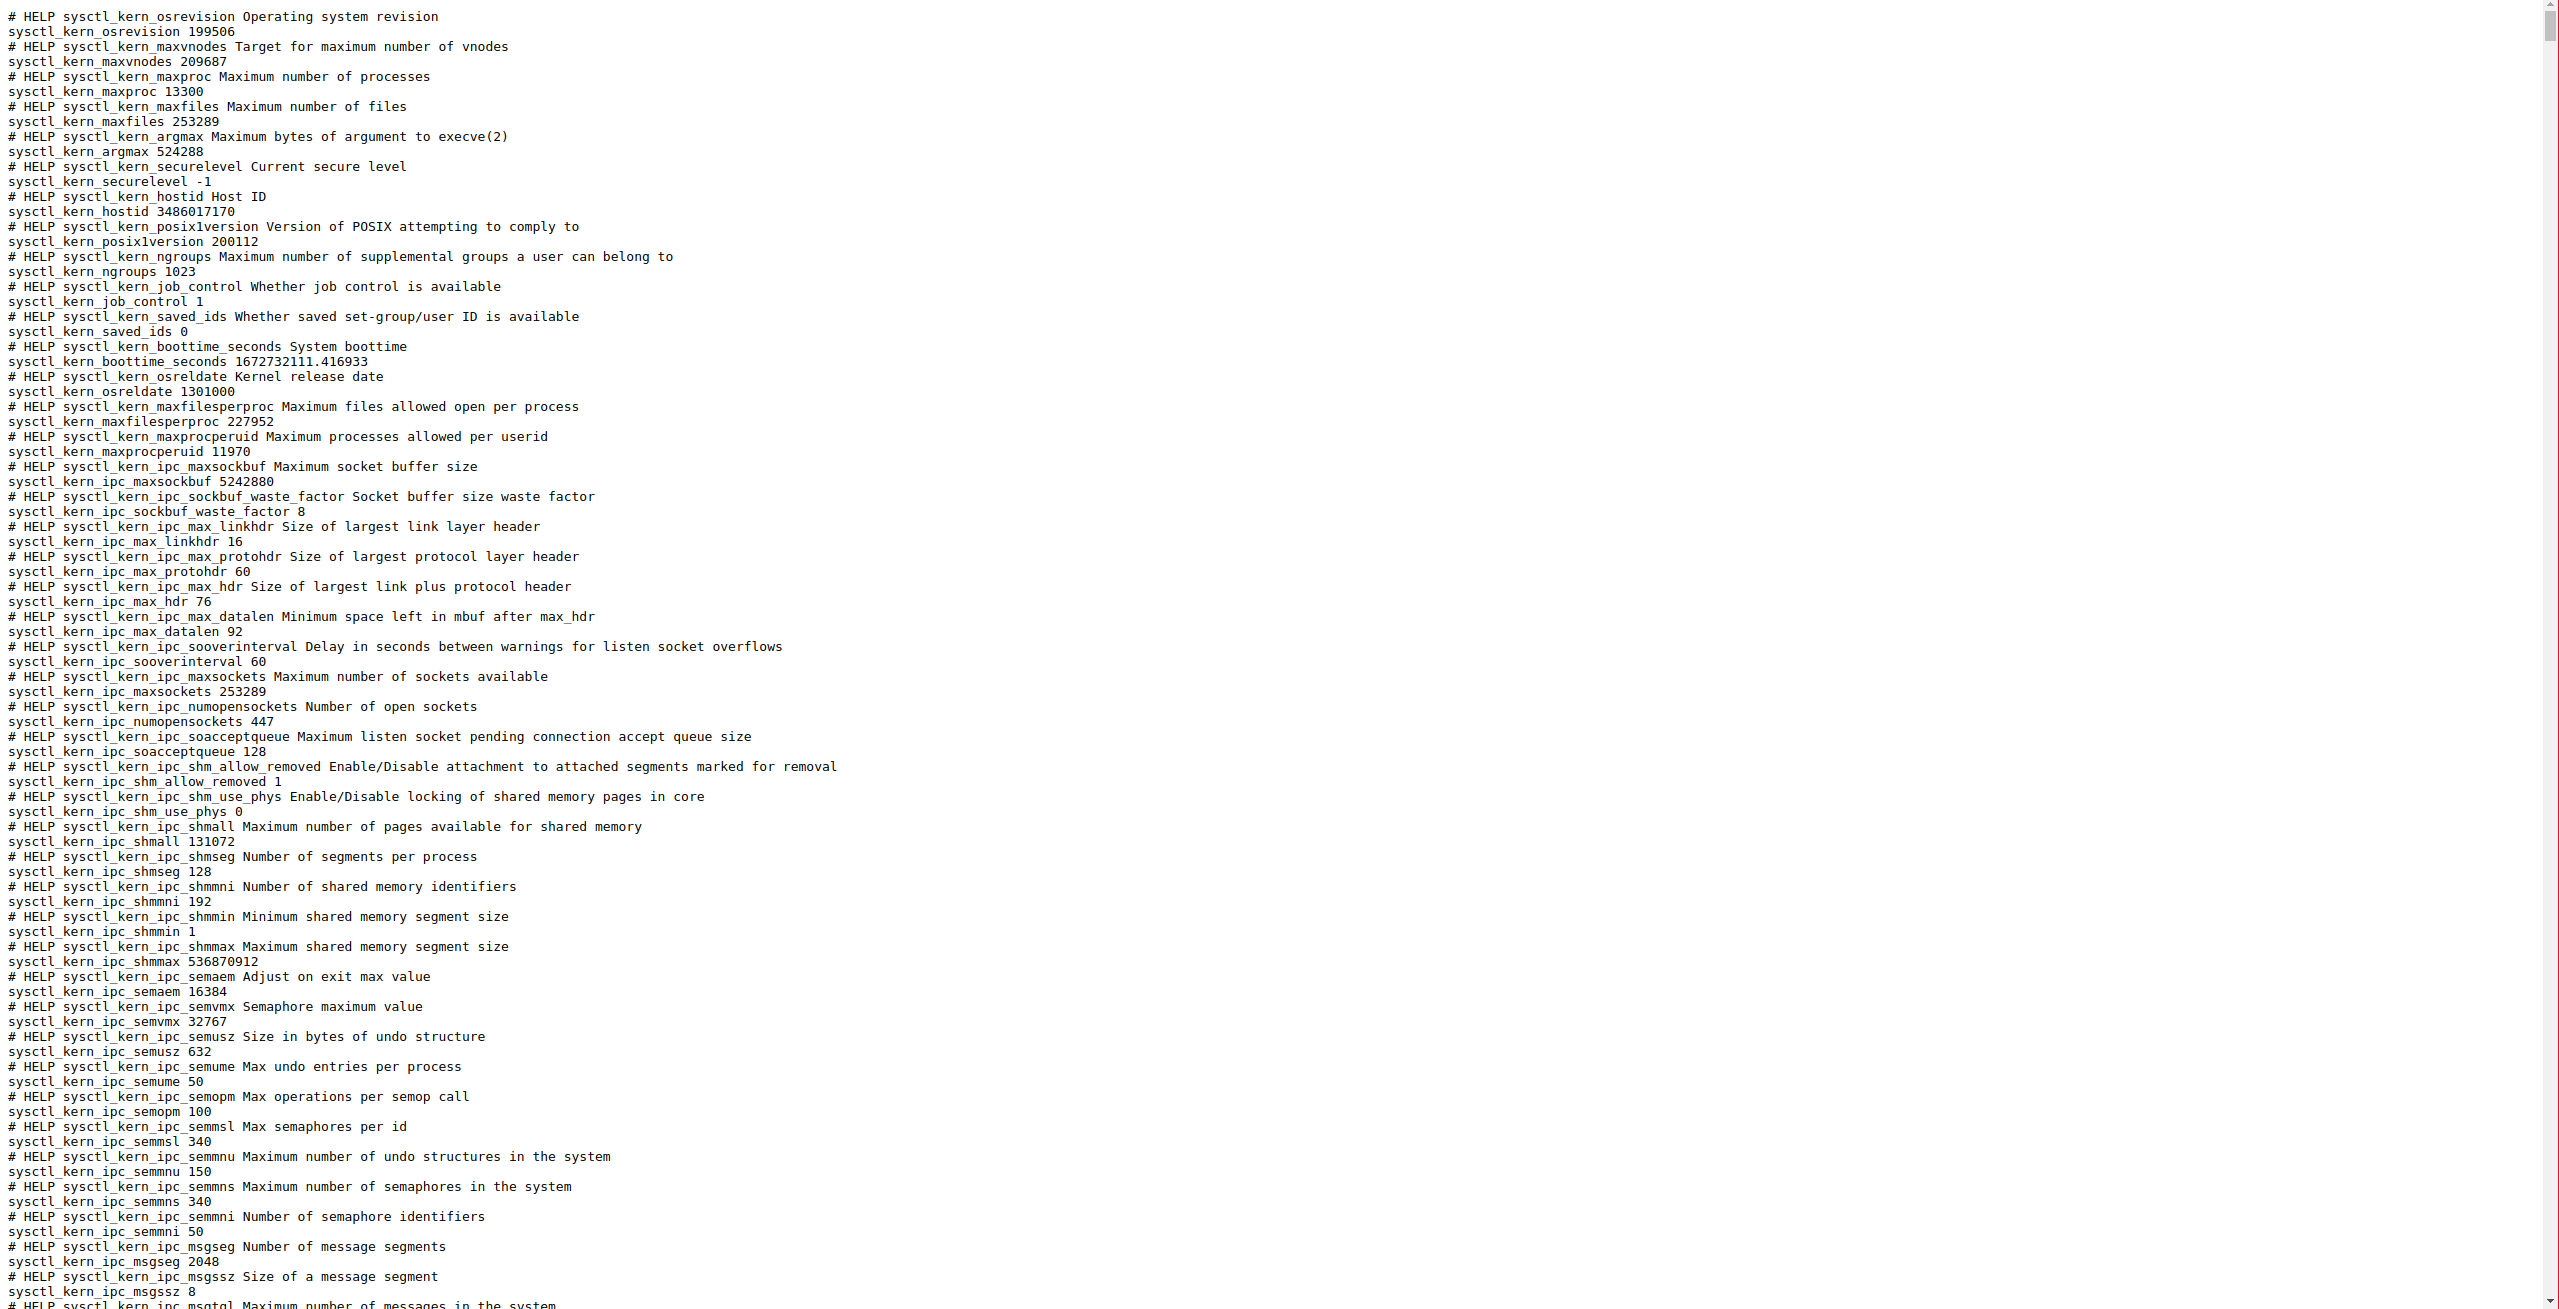
In the cmdwatch console we will see:
nobody 36991 0.0 0.0 13100 2532 - Rs 12:11 0:00.03 prometheus_sysctl_exporter -dgh (prometheus_sysctl_e)
TextCollector
If we don’t want to use Inetd to launch the exporter, we can delegate to the default text exporter of node_exporter, but we need to install one more software: node_exporter.
We install the necessary software:
We schedule the execution of prometheus_sysctl_exporter:
*/1 * * * * root prometheus_sysctl_exporter | sponge /var/tmp/node_exporter/sysctl_exporter.prom
node_exporter exposes by default all the metrics of the files in the directory: /var/tmp/node_exporter/*.prom, in this way we will achieve the same result as with the Inetd service.
If we have opted for Inetd, we must add a scrape to the Prometheus configuration, if we have used the text collector we can omit this part:
...
scrape_configs:
...
  - job_name: 'prometheus_sysctl_exporter'
    scrape_interval: 30s
    static_configs:
      - targets:
        - mightymax:9124
...
We restart the service:
One of the Grafana dashboards that plots the exporter’s data is the ZFS statistics:
https://grafana.com/grafana/dashboards/12628
After importing the dashboard, we will see graphs like these:
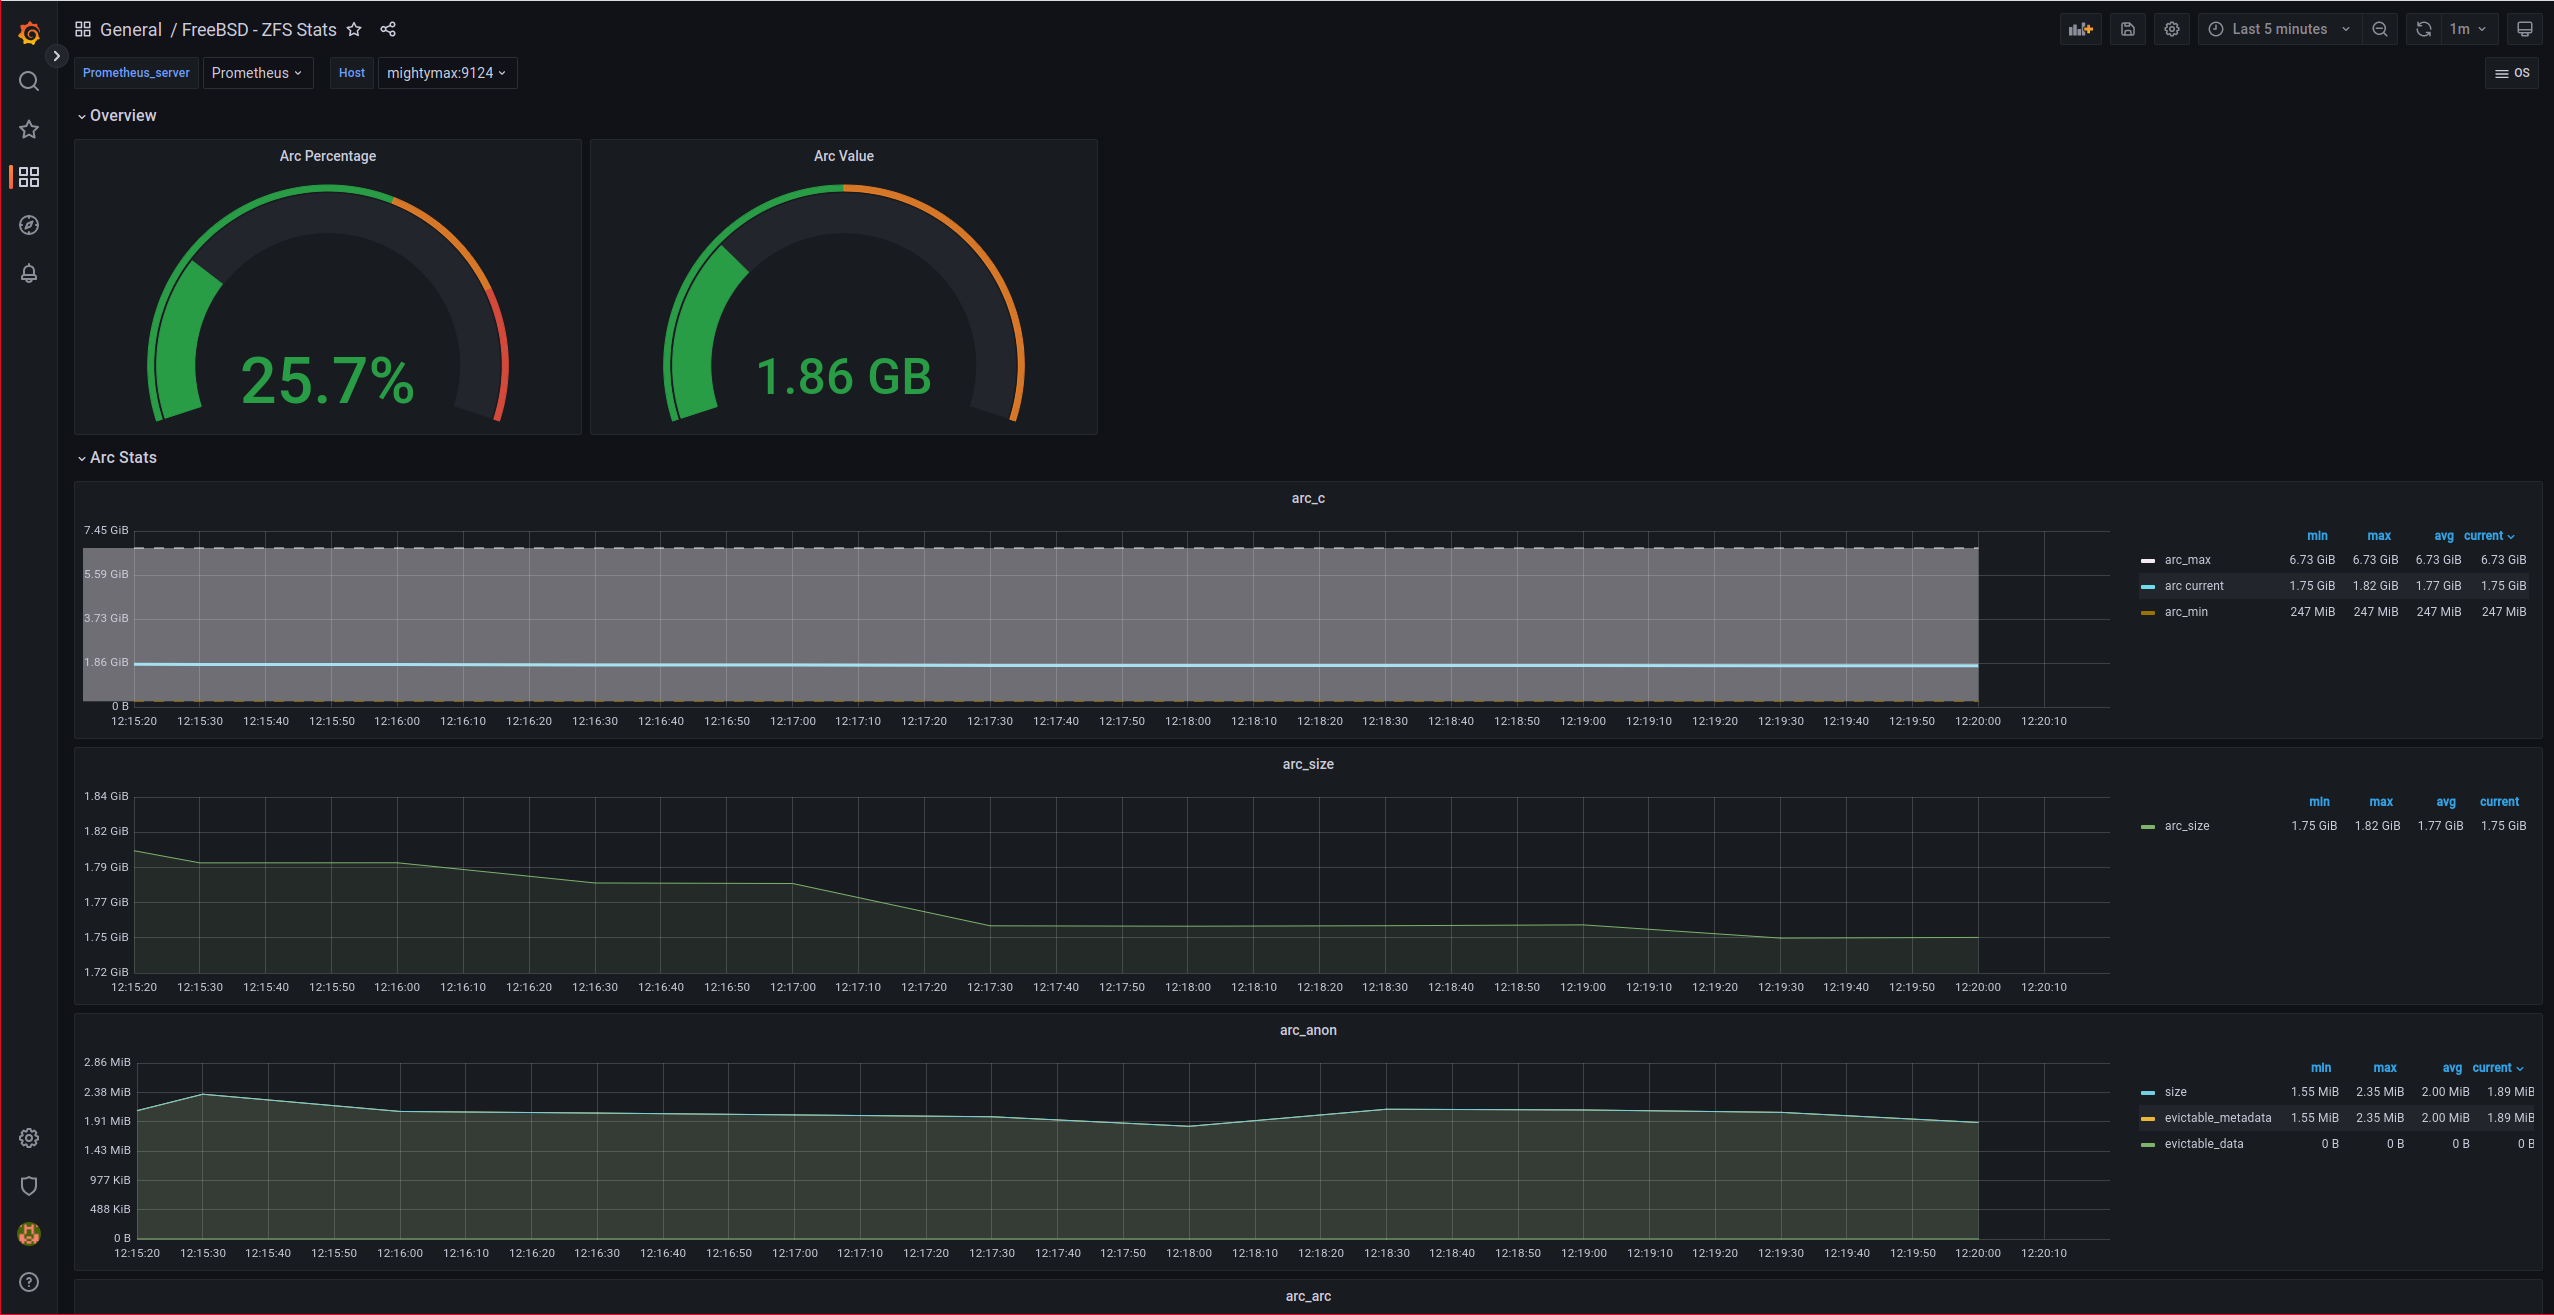
NOTE: For some reason, the “gauges” in the Overview of the dashboard did not appear correctly until I edited them, changed the chart type and set them back to “gauge”.