In this guide, we will see how to install and configure Prometheus and Grafana in such a way that we will be able to monitor metrics from remote servers using node_exporter. But before we begin, we must be clear about the tasks that each of the involved elements will perform:
- Prometheus : System for collecting and storing metrics obtained from exporters, it is also capable of generating alerts based on the obtained metrics.
- Grafana : System for visualizing the metrics stored in the Prometheus database.
- Node Exporter : Agent capable of collecting certain metrics and exposing them in a web interface to be queried from the Prometheus server.
We check the latest version of Grafana:
grafana7-7.5.15_5              Dashboard and graph editor for multiple data stores
grafana8-8.5.15                Dashboard and graph editor for multiple data stores
grafana9-9.2.7                 Dashboard and graph editor for multiple data stores
As for Prometheus, there is only one available version. We install Prometheus and Grafana:
We enable the services:
sysrc grafana_enable=YES
We start the services:
service grafana start
In my local network, I don’t have any DNS server set up, so to refer to the machines by name, I need to add them to the /etc/hosts file on the Prometheus server:
192.168.69.2        mightymax
192.168.69.4        garrus
192.168.69.16		baudbeauty
192.168.69.17		hellstorm
192.168.69.18		paradox
192.168.69.19		atlas
192.168.69.20		metacortex
We add the server to be monitored:
...
scrape_configs:
...
  - job_name: 'node_exporter'
    scrape_interval: 30s
    static_configs:
      - targets:
        - mightymax:9100
...
We restart the service:
In my case, external access will go through an HAProxy, so the firewall rules must allow access to it:
# HTTP + HTTPS: INET - HAProxy
$cmd 00801 allow tcp from any to 192.168.69.19 80 in via $wanif
$cmd 00801 allow tcp from 192.168.69.19 80 to any out via $wanif

$cmd 00802 allow tcp from any to 192.168.69.19 443 in via $wanif
$cmd 00802 allow tcp from 192.168.69.19 443 to any out via $wanif
The HAProxy configuration would be as follows, allowing access to port 80 only if it is Let’s Encrypt renewing the certificate:
frontend HTTP
    bind :80
    option forwardfor

    # Allow http access only for LetsEncrypt:
    acl letsencrypt path_beg /.well-known/acme-challenge/
    http-request redirect scheme https unless letsencrypt

    acl prometheus hdr(host) -i prometheus.alfaexploit.com
    acl grafana hdr(host) -i grafana.alfaexploit.com

    http-request deny if !prometheus !grafana

    use_backend prometheus if prometheus
    use_backend prometheus if grafana

frontend HTTP-SSL
    bind :443
    mode tcp

    acl prometheus_ssl req.ssl_sni -i prometheus.alfaexploit.com
    acl grafana_ssl req.ssl_sni -i grafana.alfaexploit.com

    tcp-request inspect-delay 2s
    tcp-request content reject if !prometheus_ssl !grafana_ssl

    use_backend prometheus_ssl if prometheus_ssl
    use_backend prometheus_ssl if grafana_ssl

backend prometheus
    server prometheus 192.168.69.21:80 check

backend prometheus_ssl
    mode tcp
    option ssl-hello-chk
    server prometheus 192.168.69.21:443 check sni req.ssl_sni send-proxy-v2
We restart the service:
Both the Prometheus and Grafana interfaces work in plain text. If we want to provide access from outside, we need to install a web server like Nginx and configure SSL:
We enable and start the service:
service nginx start
We install ACME:
We configure the DNS so that the subdomains prometheus.alfaexploit.com and grafana.alfaexploit.com point to the monitoring server, then we generate the certificate:
[Tue Jan  3 11:40:36 CET 2023] Your cert is in: /root/.acme.sh/prometheus.alfaexploit.com/prometheus.alfaexploit.com.cer
[Tue Jan  3 11:40:36 CET 2023] Your cert key is in: /root/.acme.sh/prometheus.alfaexploit.com/prometheus.alfaexploit.com.key
[Tue Jan  3 11:40:36 CET 2023] The intermediate CA cert is in: /root/.acme.sh/prometheus.alfaexploit.com/ca.cer
[Tue Jan  3 11:40:36 CET 2023] And the full chain certs is there: /root/.acme.sh/prometheus.alfaexploit.com/fullchain.cer
We configure Nginx to serve the Prometheus and Grafana interfaces with the obtained certificate:
...
http {
    include prometheus.conf;
...
server {
    listen 443 ssl proxy_protocol;
    server_name prometheus.alfaexploit.com;

    set_real_ip_from 192.168.69.19;
    real_ip_header proxy_protocol;

    ssl_certificate "/root/.acme.sh/prometheus.alfaexploit.com/fullchain.cer";
    ssl_certificate_key "/root/.acme.sh/prometheus.alfaexploit.com/prometheus.alfaexploit.com.key";

    location / {
        auth_basic "Restricted Content";
        auth_basic_user_file /usr/local/etc/nginx/.htpasswd;
        proxy_pass http://localhost:9090;
    }
}

server {
    listen 443 ssl proxy_protocol;
    server_name grafana.alfaexploit.com;

    set_real_ip_from 192.168.69.11;
    real_ip_header proxy_protocol;

    ssl_certificate "/root/.acme.sh/prometheus.alfaexploit.com/fullchain.cer";
    ssl_certificate_key "/root/.acme.sh/prometheus.alfaexploit.com/prometheus.alfaexploit.com.key";

    location / {
        proxy_set_header Host $http_host;
        proxy_pass http://localhost:3000;
    }
}
We generate the password file for the prometheus.alfaexploit.com domain. For grafana.alfaexploit.com, it is not necessary as it has its own login:
openssl passwd -apr1 >> /usr/local/etc/nginx/.htpasswd
chown www /usr/local/etc/nginx/.htpasswd
chmod 600 /usr/local/etc/nginx/.htpasswd
We restart Nginx:
On the server to be monitored, we install node exporter, which will provide us with basic OS metrics:
We enable the service:
We start the service:
Now we can access both Grafana and Prometheus:
https://grafana.alfaexploit.com
admin/admin
It will ask for a new password.
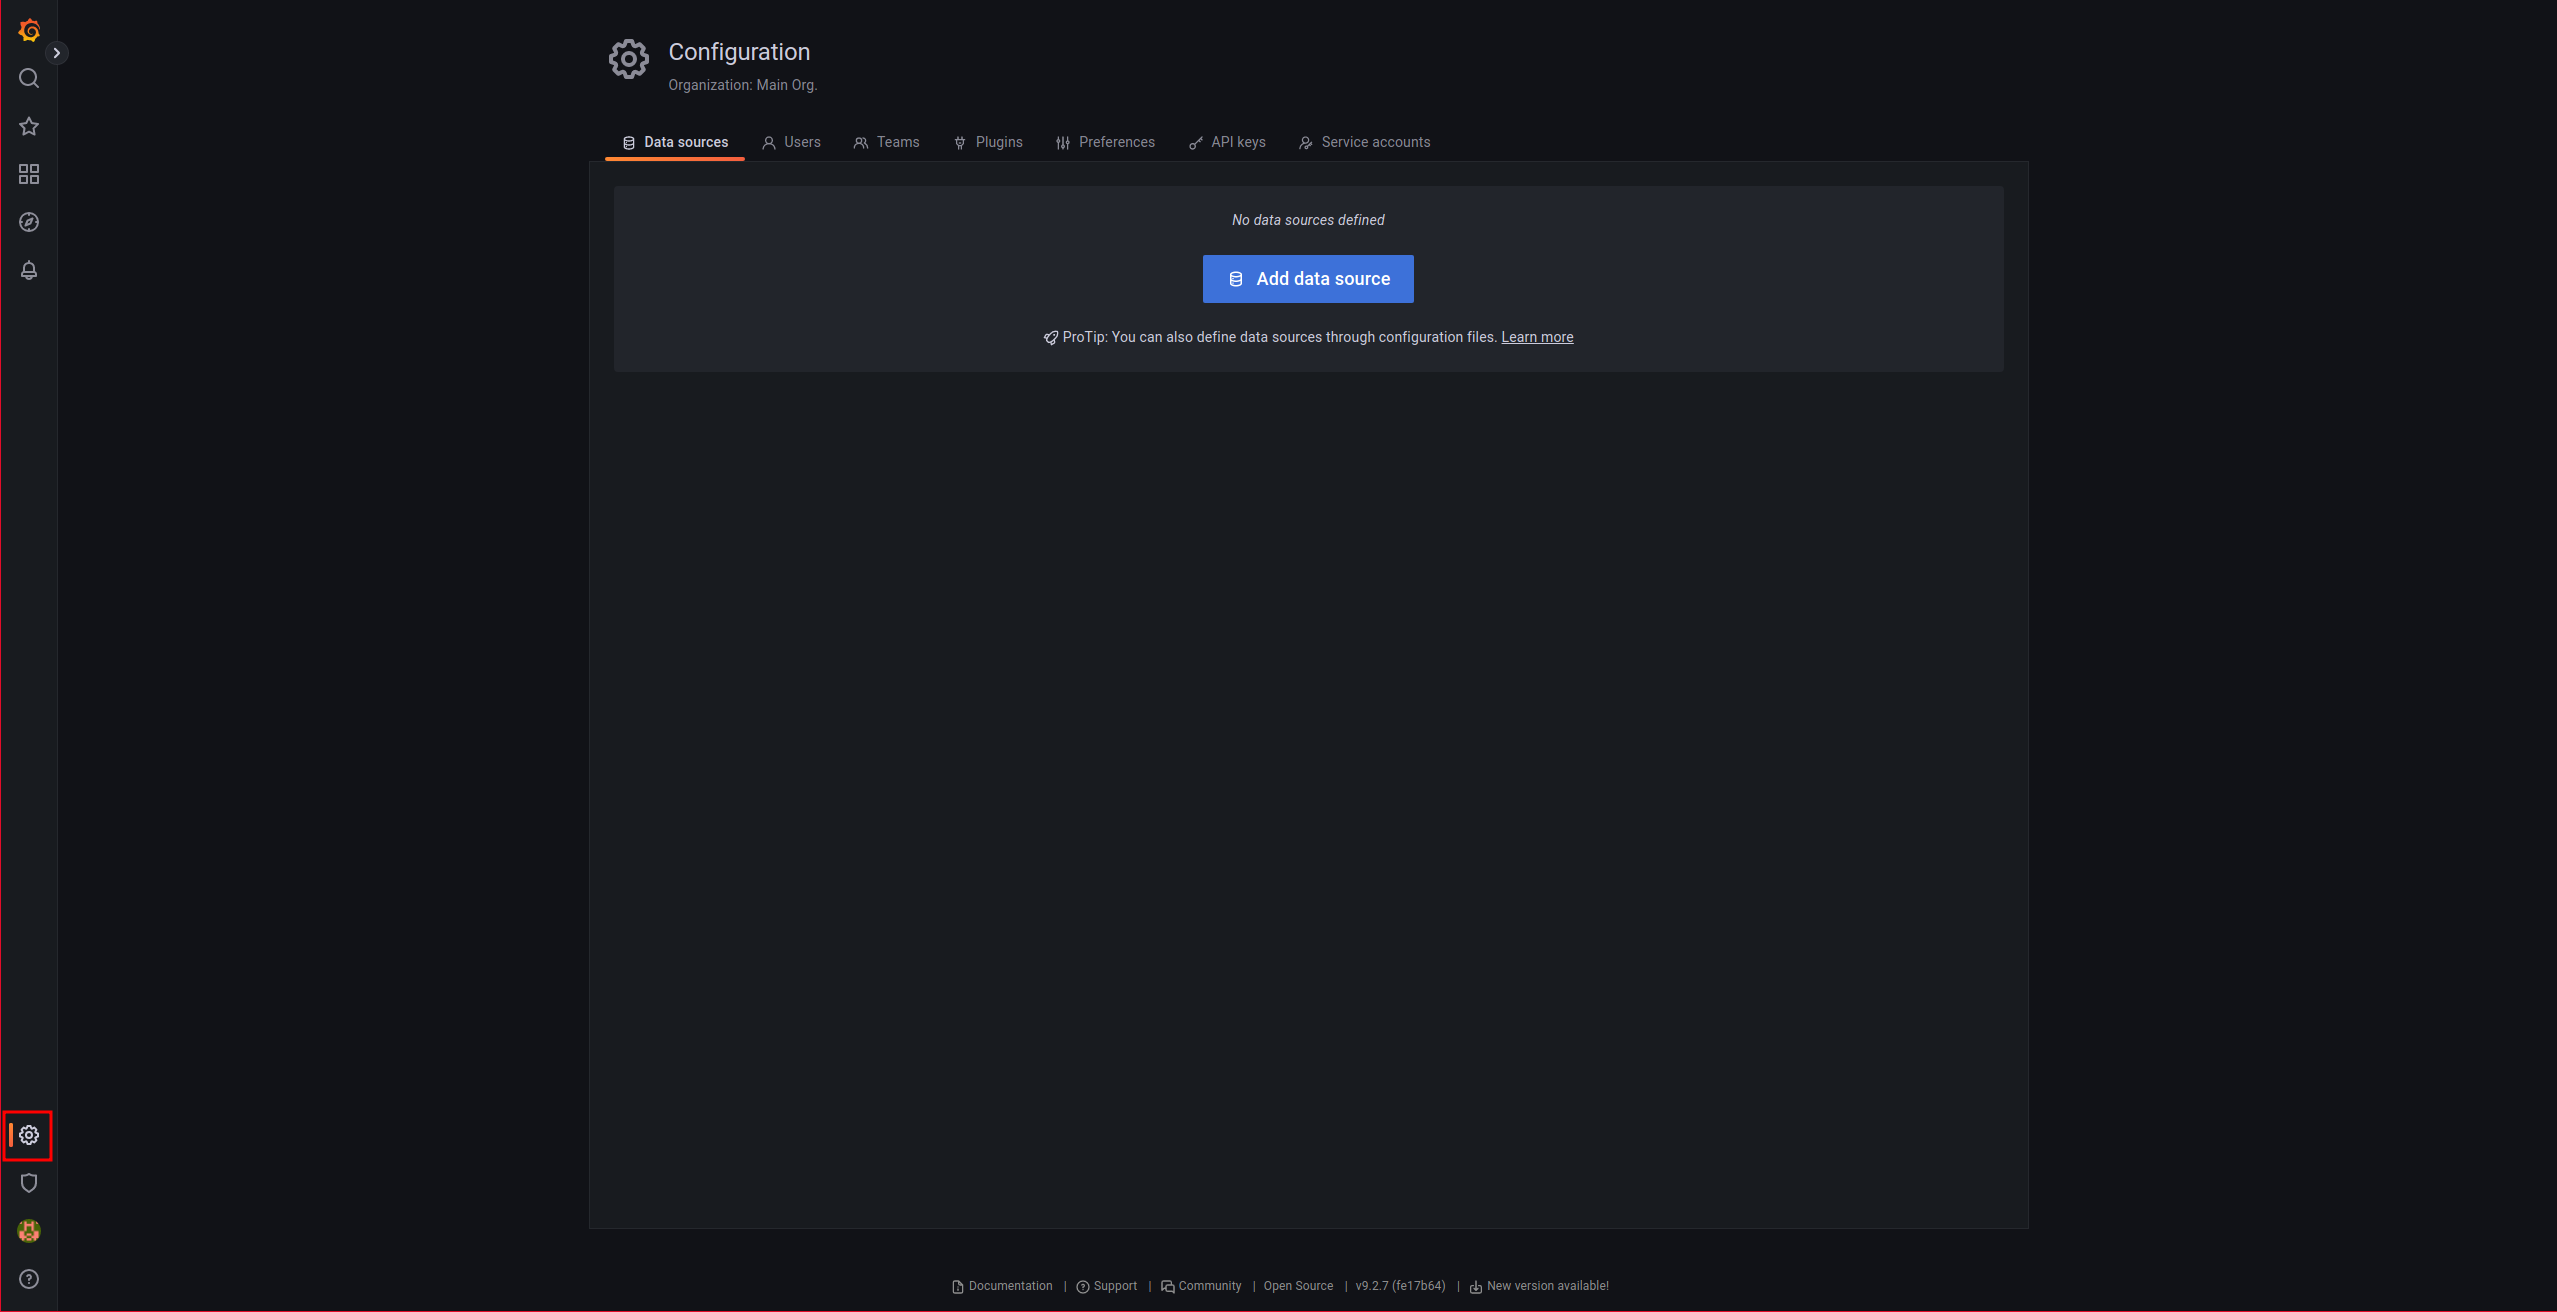
We add a data source, click on the gear on the left:
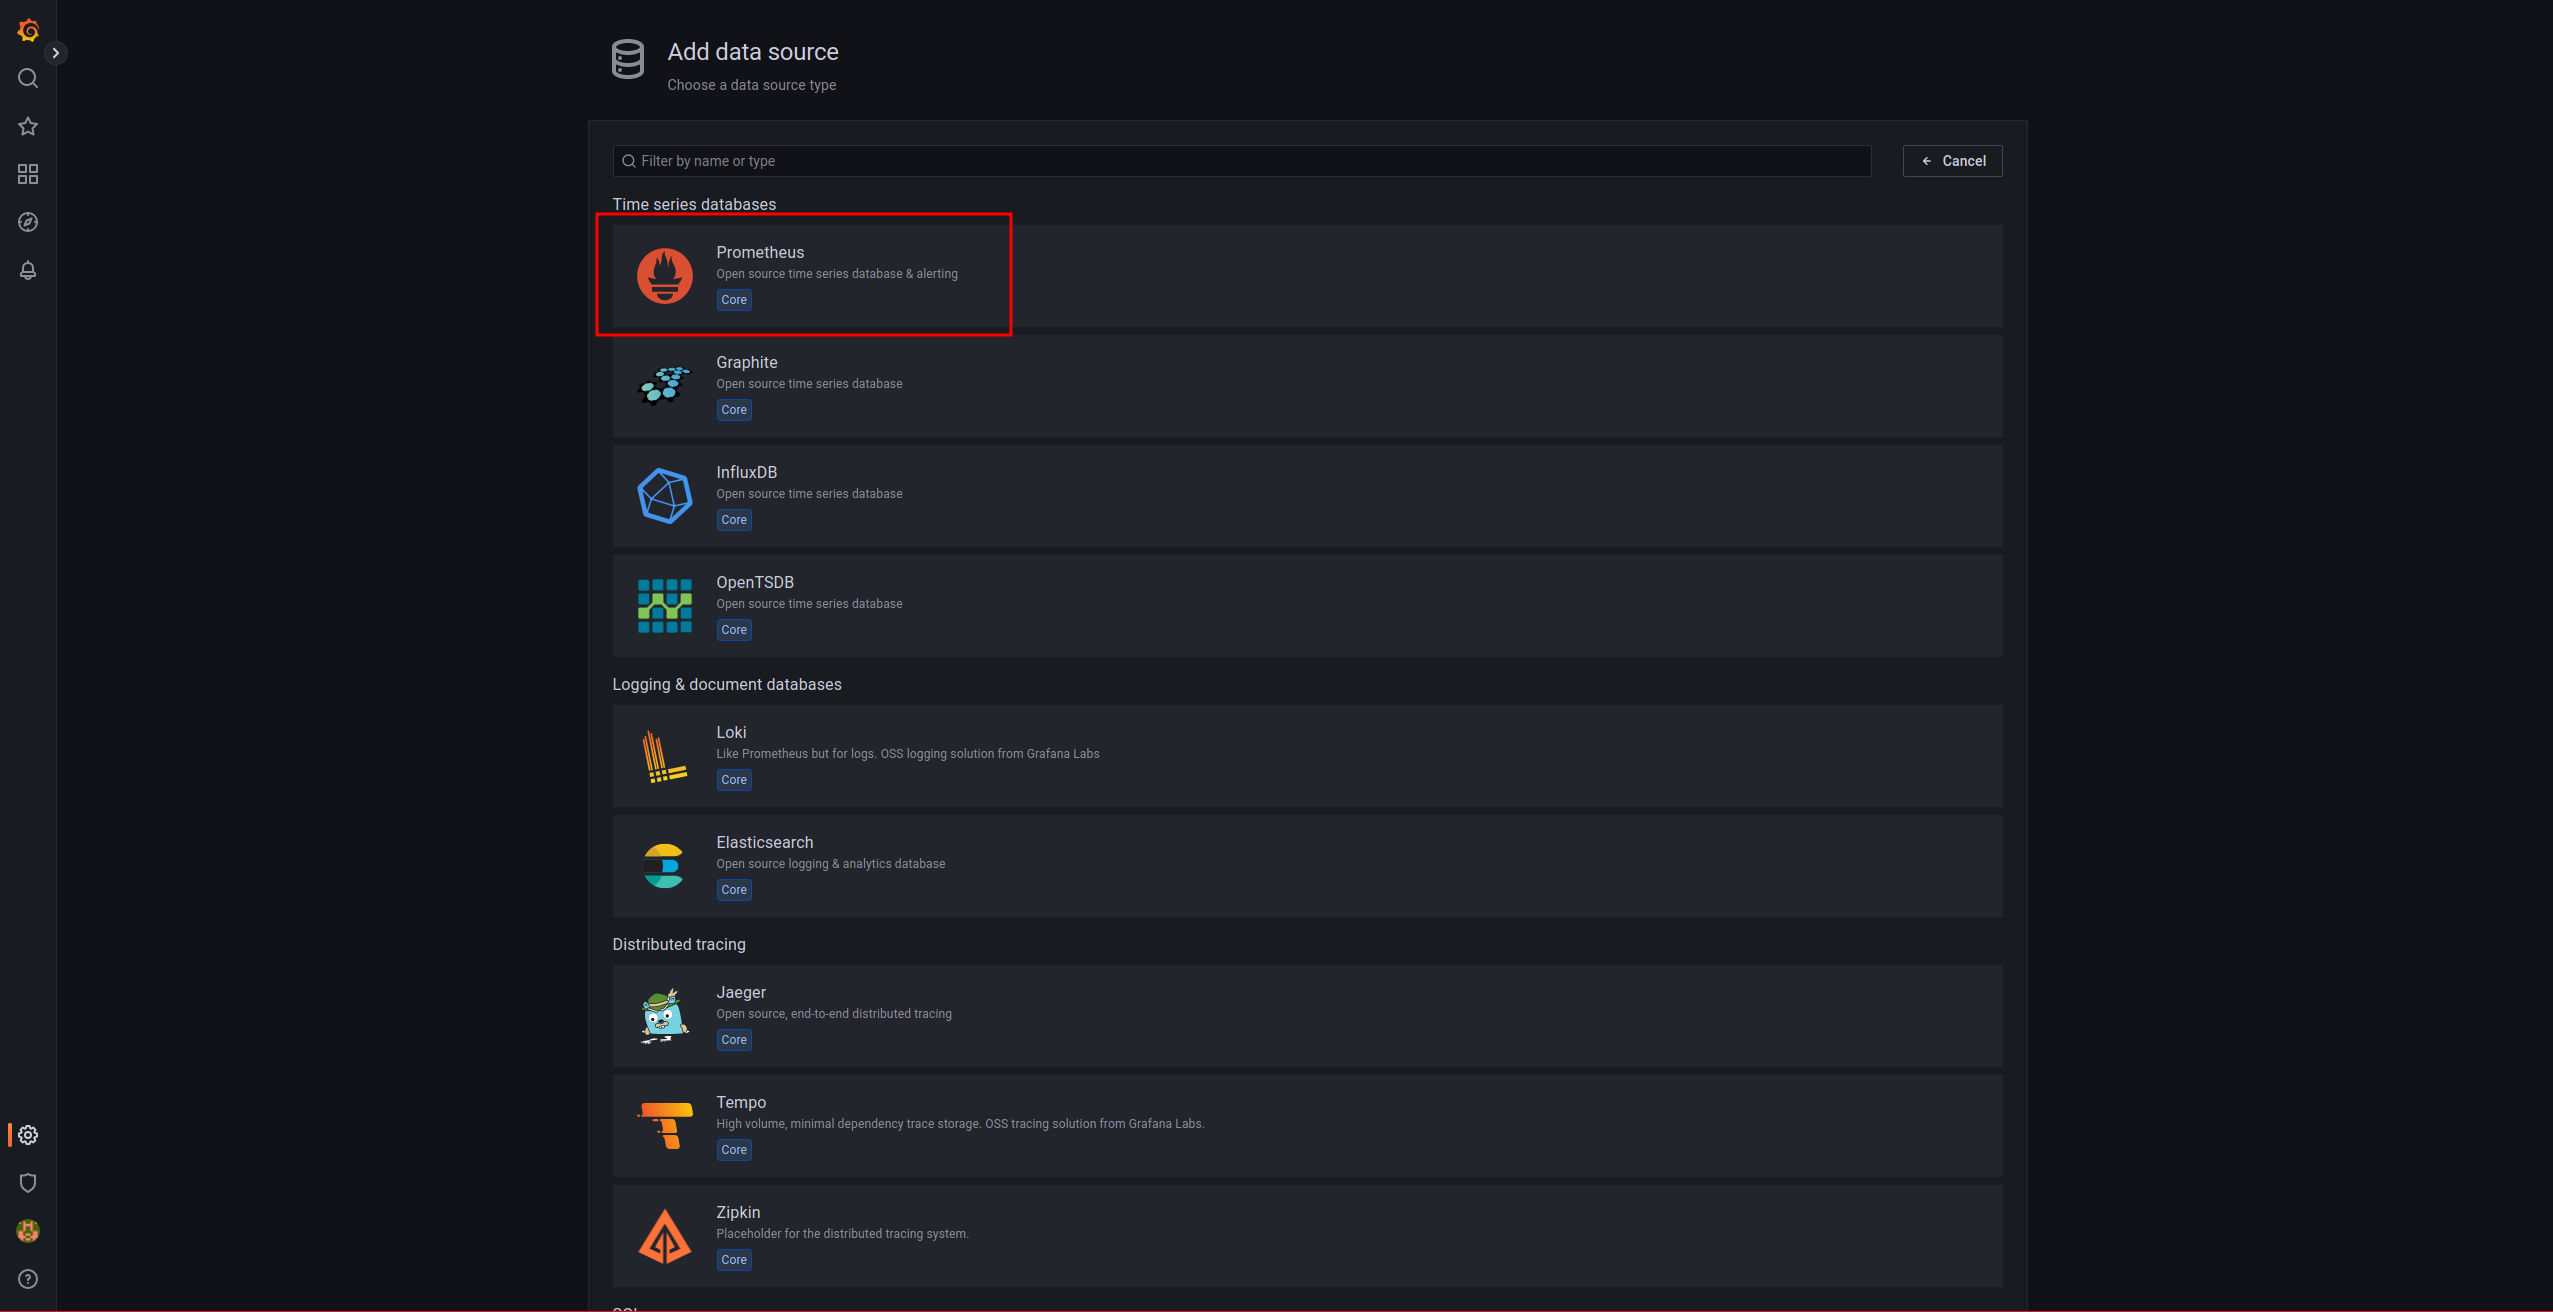
We add a data source:

We indicate that it is a Prometheus database:
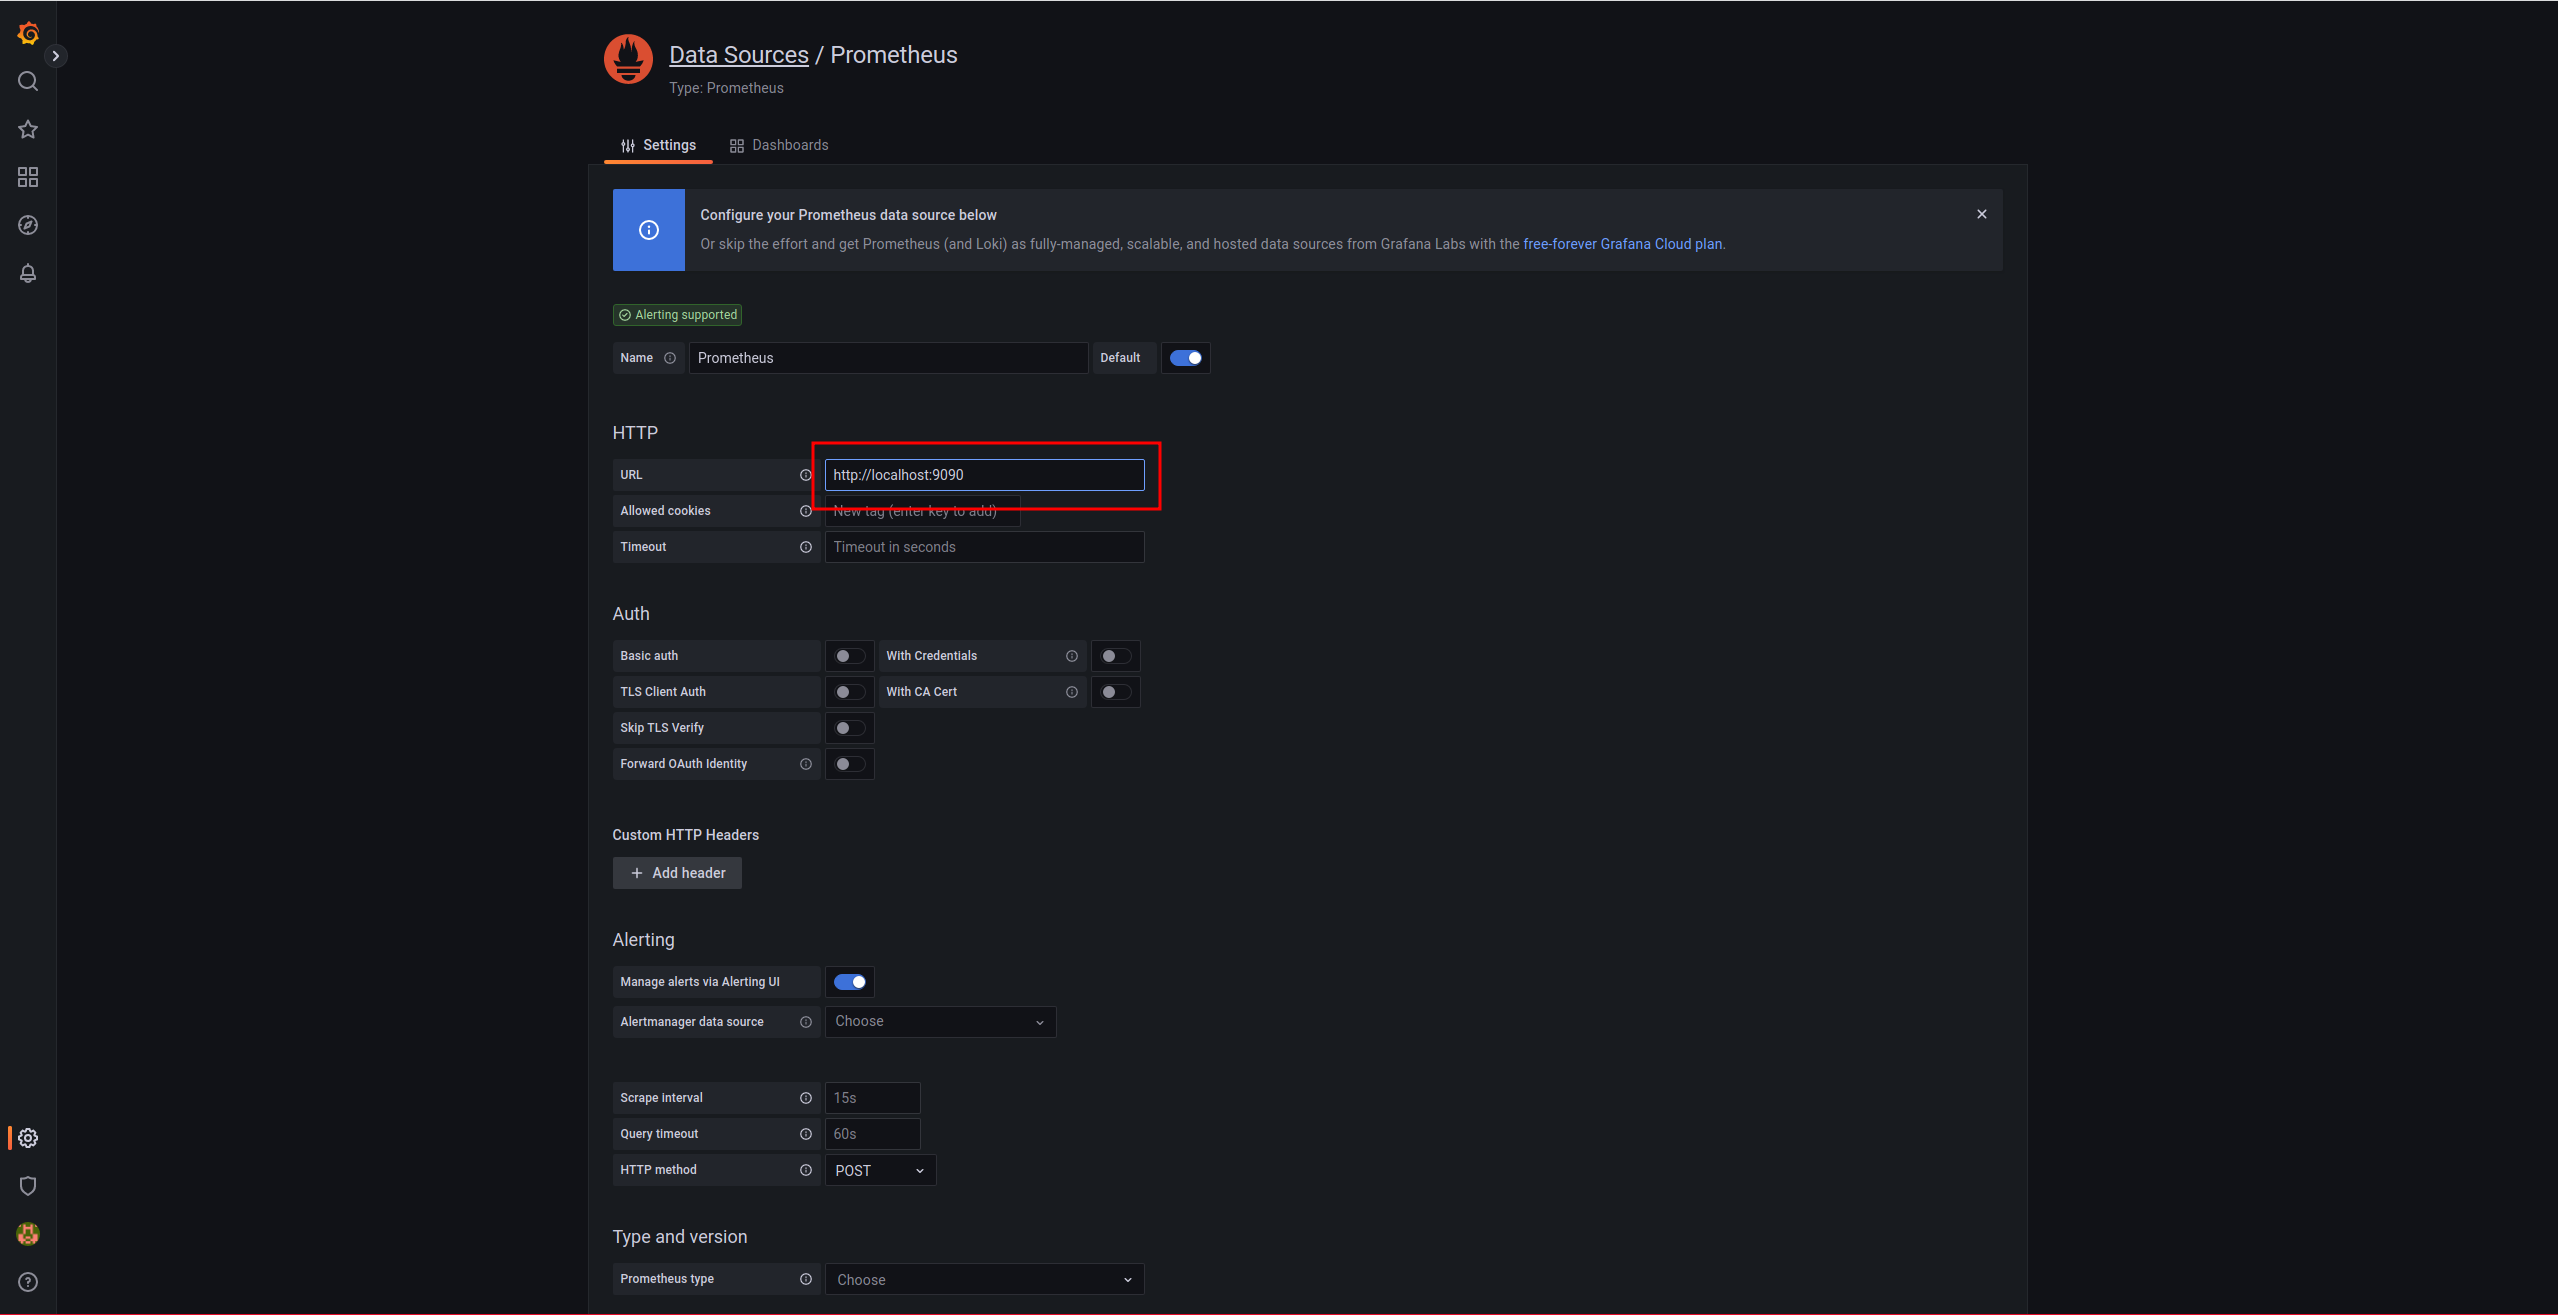
We indicate the URL:
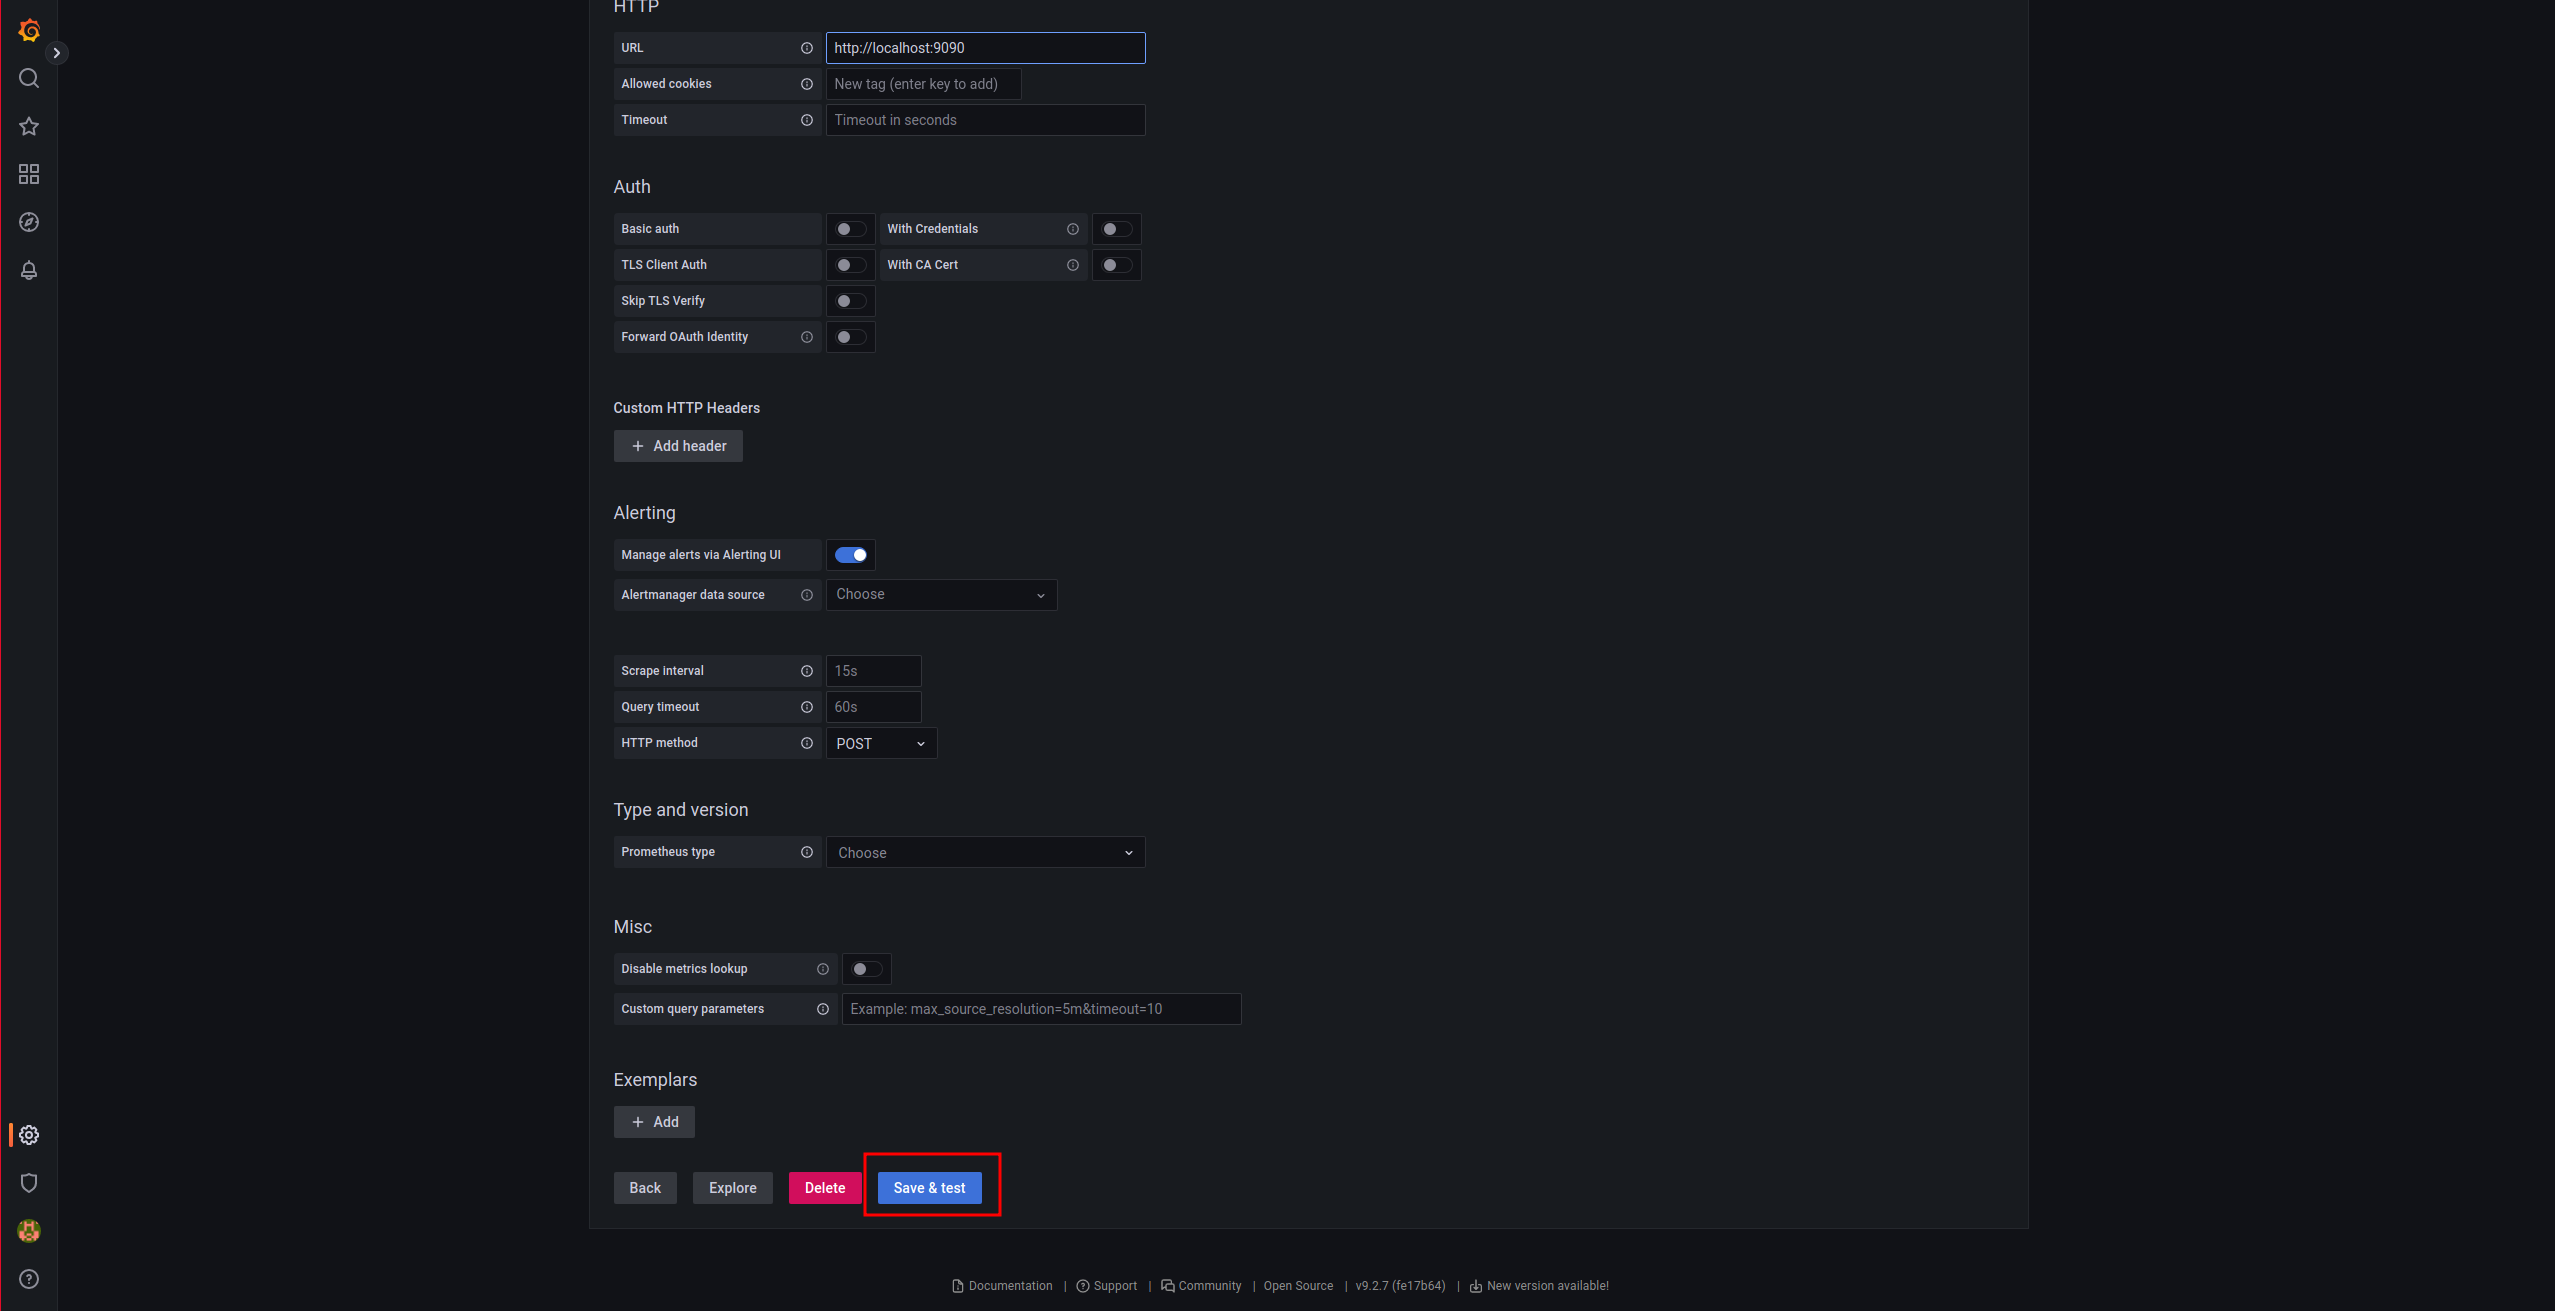
And we save:
To visualize the metrics collected from node_exporter, it is necessary to import a Grafana dashboard:
https://grafana.com/grafana/dashboards/4260
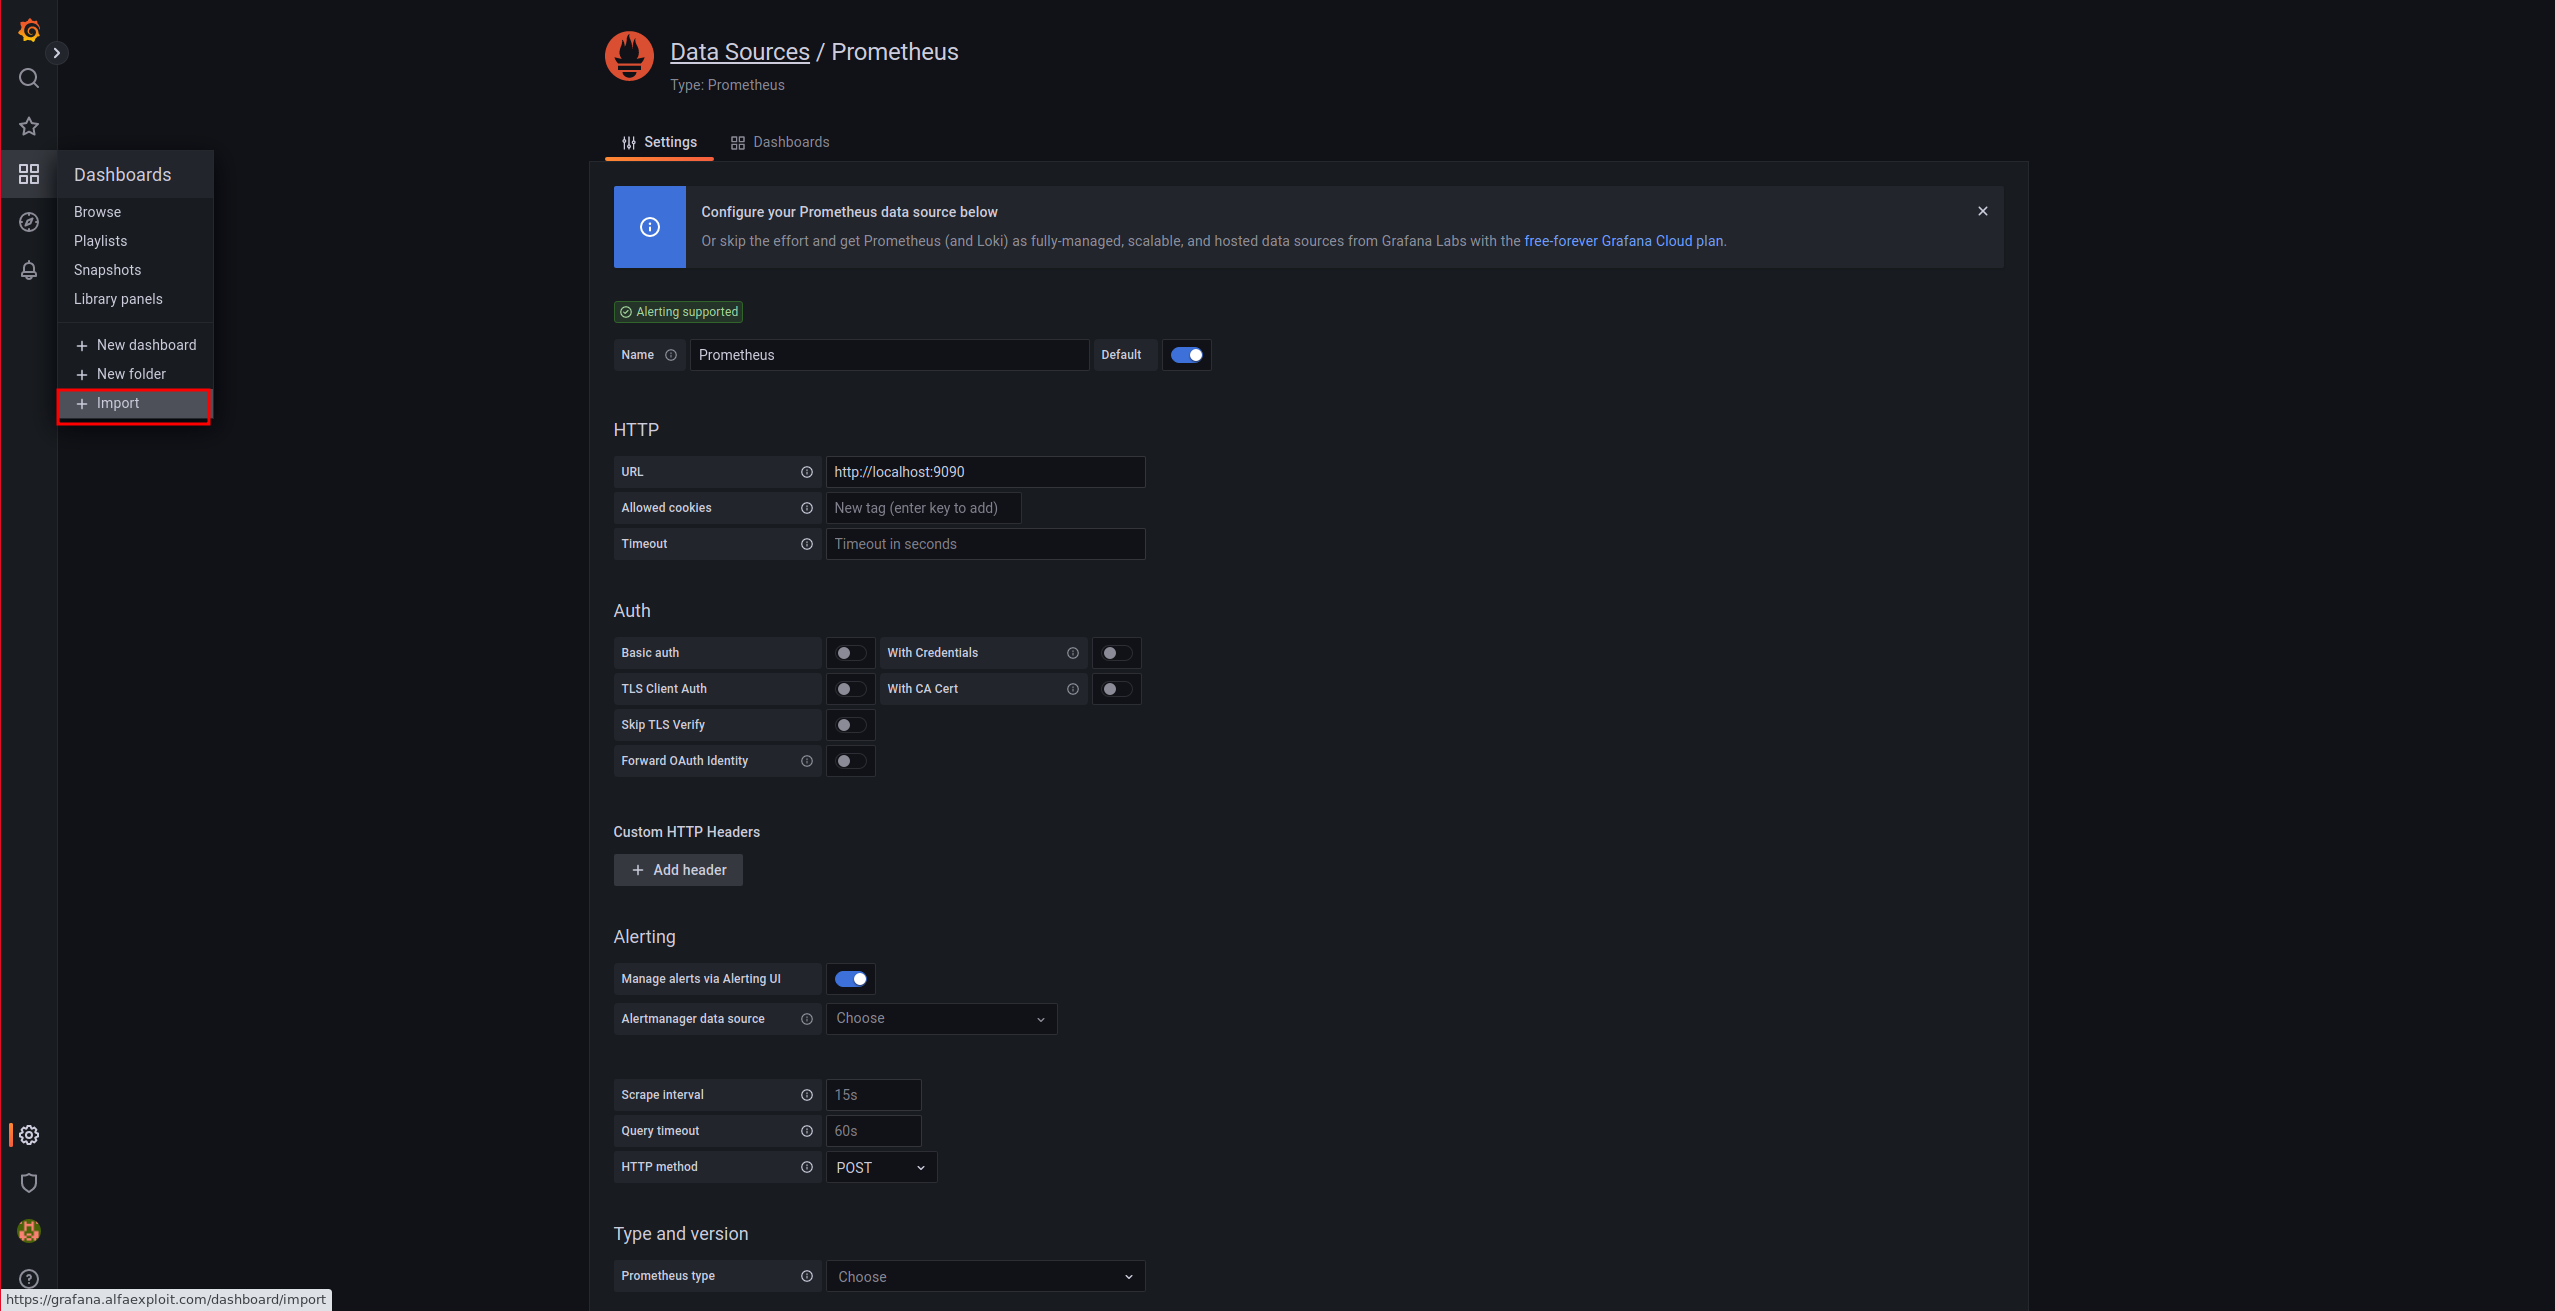
Click on Dashboards -> Import:
We indicate the URL of the dashboard and click Load:
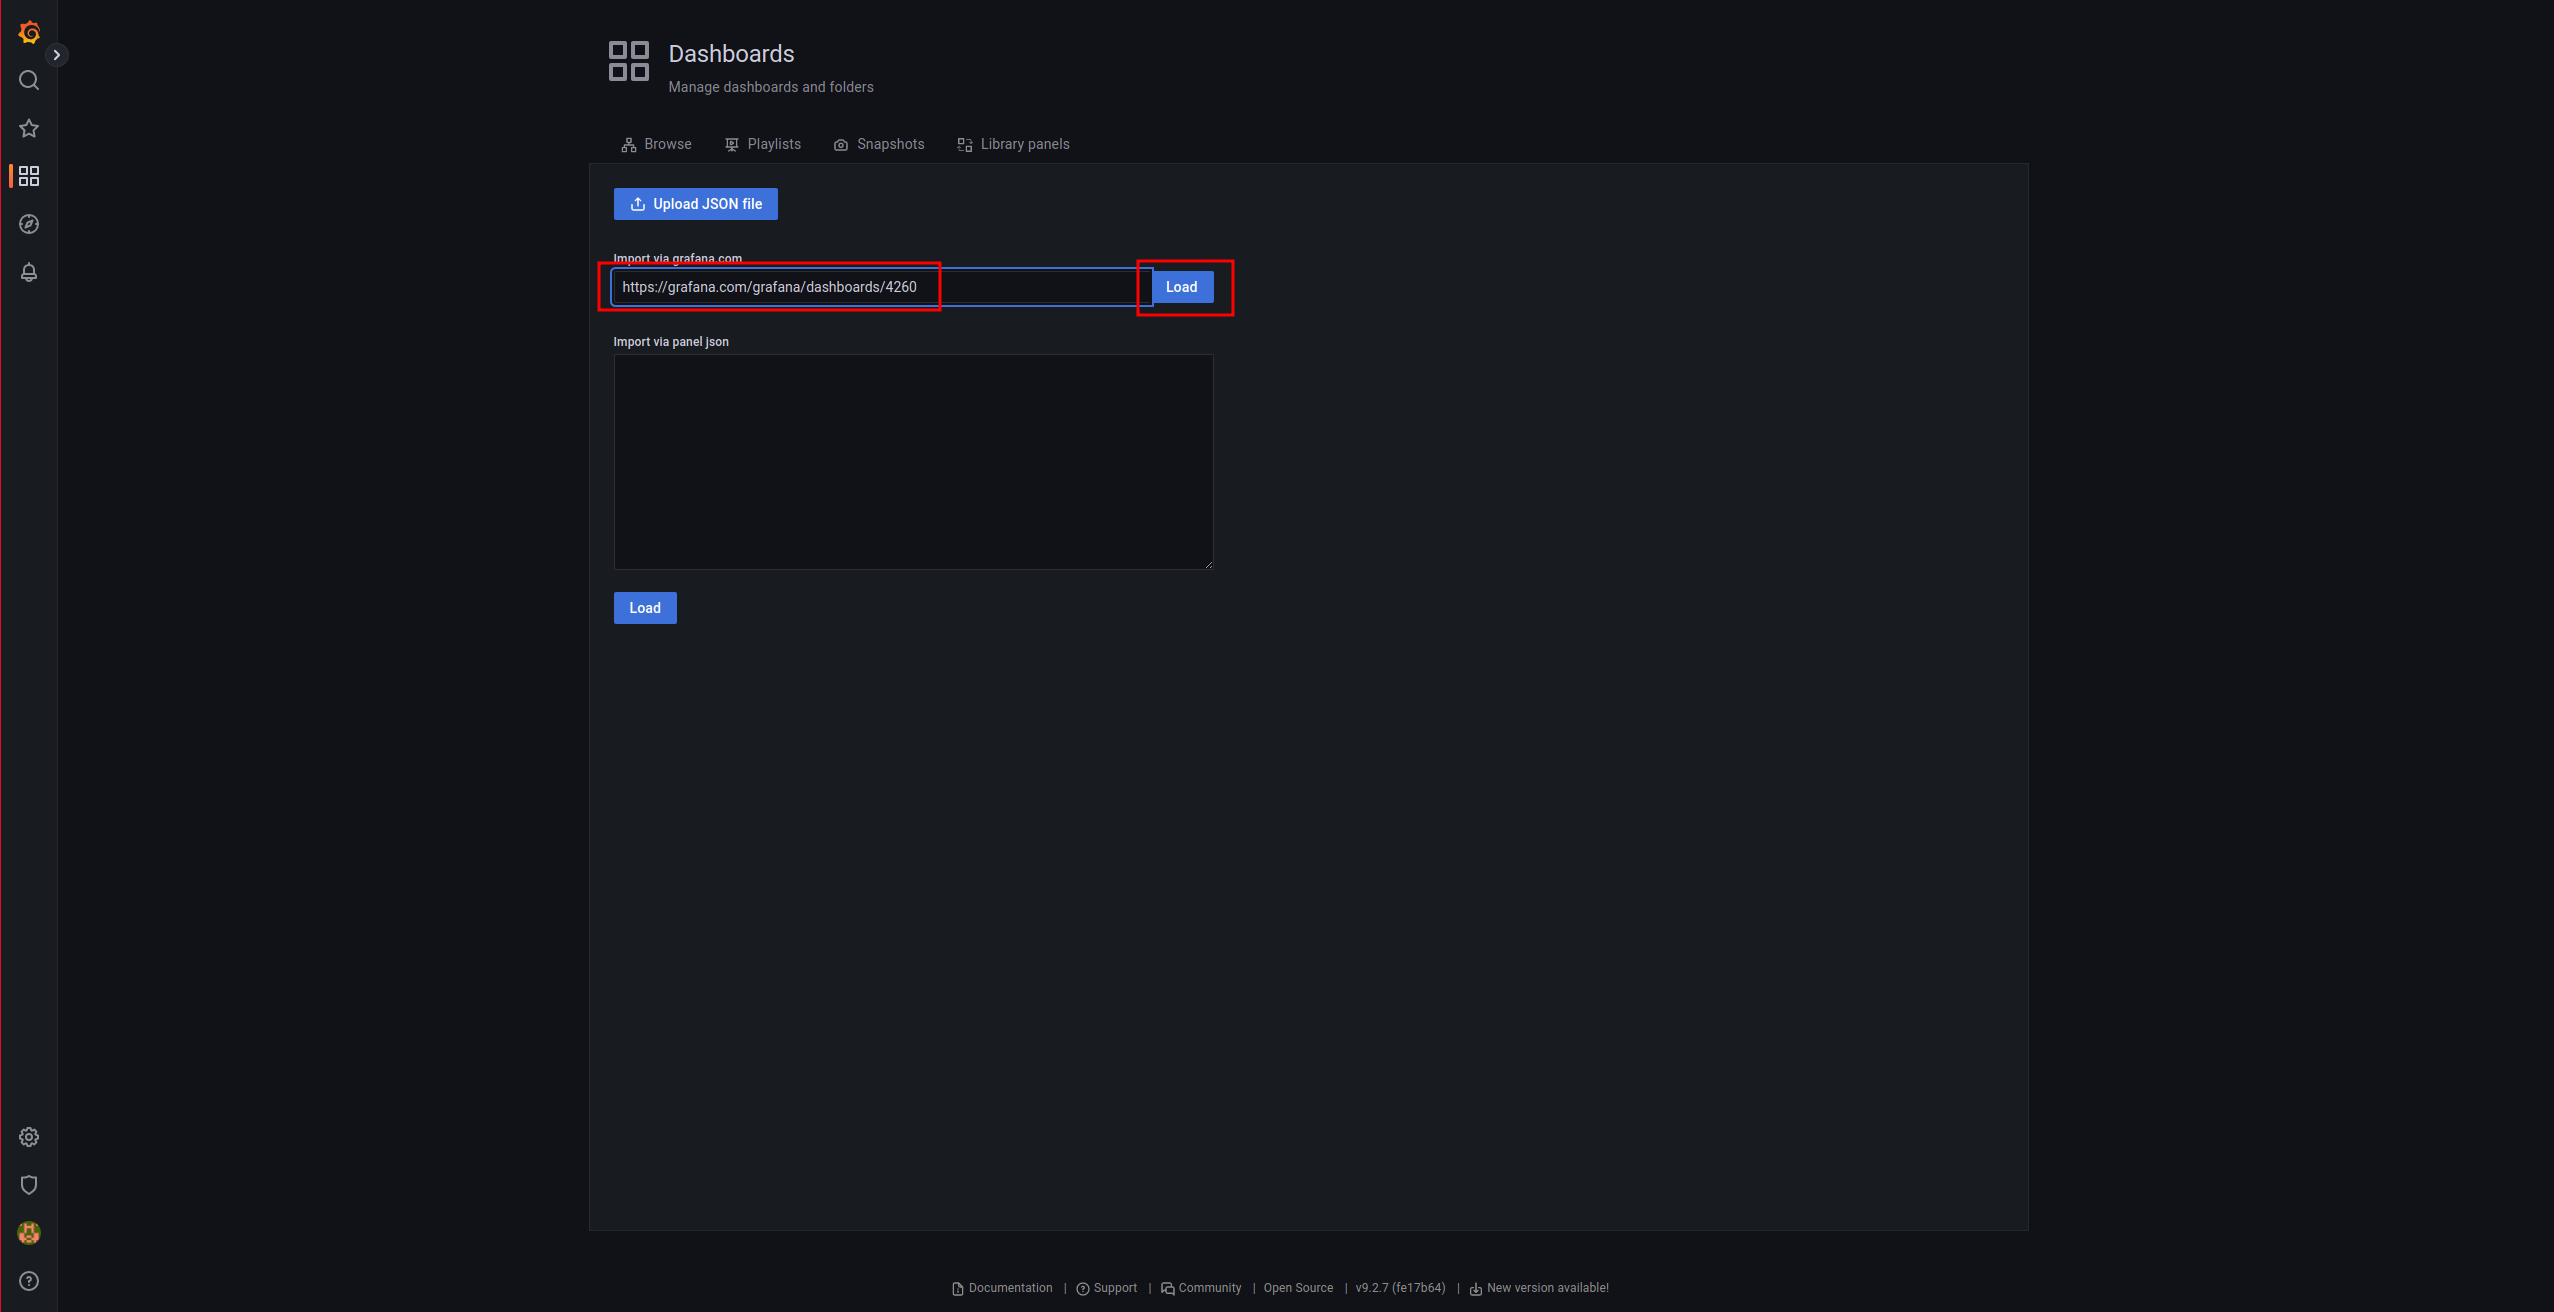
We indicate the Prometheus data source and proceed with the import:

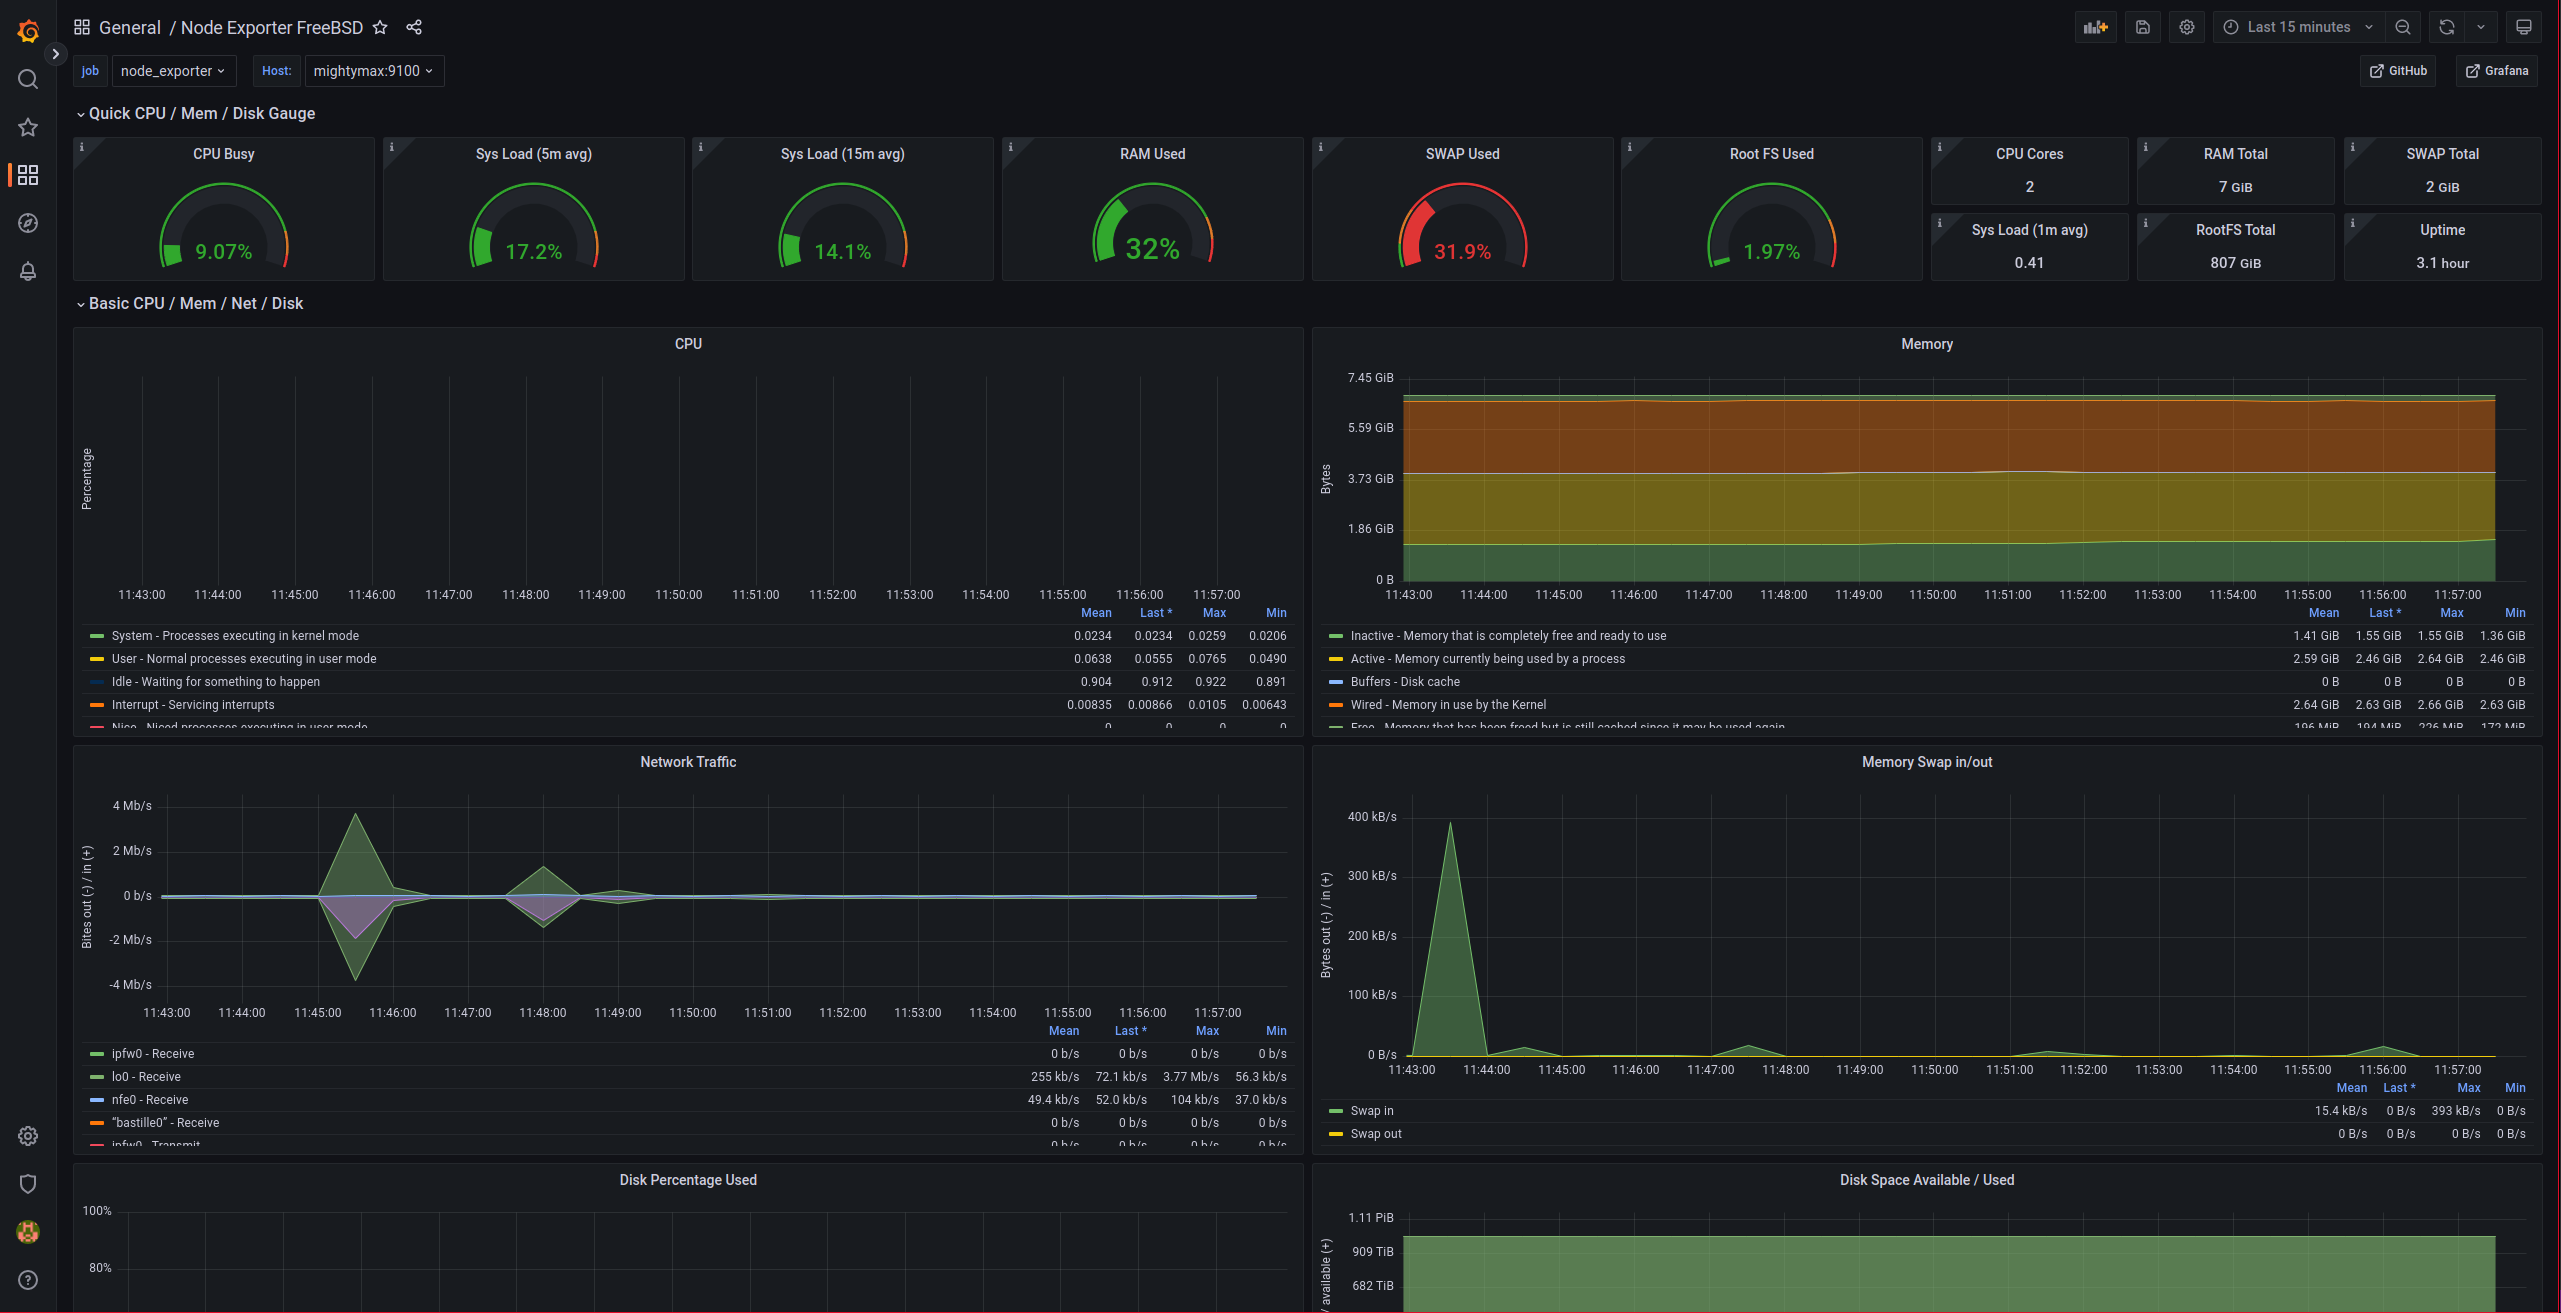
We should see something similar to this:
We verify that we can also access the Prometheus interface with a previous login:
