In this guide, we will see how to monitor the resources consumed by Jail in FreeBSD using Prometheus. If we have not installed Prometheus base first, we will follow the basic installation guide for Prometheus and Grafana.
To be able to track the resources consumed by Jail, we must enable support for
RACCT
:
kern.racct.enable=1
Restart to apply the changes:
Check that it is enabled:
kern.racct.enable: 1
Check that we can manually query the data by Jail, first we get the JID of one of the Jails:
 JID             IP Address      Hostname                      Path
 Atlas           192.168.69.19   Atlas                         /usr/local/bastille/jails/Atlas/root
 BaudBeauty      192.168.69.16   BaudBeauty                    /usr/local/bastille/jails/BaudBeauty/root
 HellStorm       192.168.69.17   HellStorm                     /usr/local/bastille/jails/HellStorm/root
 MetaCortex      192.168.69.20   MetaCortex                    /usr/local/bastille/jails/MetaCortex/root
 Paradox         192.168.69.18   Paradox                       /usr/local/bastille/jails/Paradox/root
 RECLog          192.168.69.21   RECLog                        /usr/local/bastille/jails/RECLog/root
We check the resources consumed by the Jail ioc-Infinity:
cputime=1
datasize=740K
stacksize=0
coredumpsize=0
memoryuse=48M
memorylocked=0
maxproc=6
openfiles=1104
vmemoryuse=131M
pseudoterminals=0
swapuse=13M
nthr=7
msgqqueued=0
msgqsize=0
nmsgq=0
nsem=0
nsemop=0
nshm=0
shmsize=0
wallclock=705
pcpu=0
readbps=0
writebps=0
readiops=0
writeiops=0
We install the exporter:
pkg install jail_exporter
The exporter can run in two different ways:
- As an RC service
- Using the TextCollector of node_exporter
RC Service
To enable exporter authentication, we must generate an htpass file, for which we will use the exporter itself:
Hash: $2b$12$WU7g/xOAvULdOfeiJWcpwOQp9kBaKirWig1vH4IofR9F29Eat/qh.
basic_auth_users:
    jail_exporter_user: '$2b$12$WU7g/xOAvULdOfeiJWcpwOQp9kBaKirWig1vH4IofR9F29Eat/qh.'
We enable the service and configure it according to our needs:
sysrc jail_exporter_listen_address=192.168.69.2:9452
sysrc jail_exporter_args=–web.auth-config=/usr/local/jail_exporter/auth.yml
Manually start the exporter to ensure that there are no issues:
We can see the socket open on port 9452:
root jail_expor 56107 6 tcp4 192.168.69.2:9452 *:* LISTEN
Start the exporter using the RC script:
TextCollector
If we choose to use the TextCollector of node_exporter, we must first install it:
Schedule the execution of jail_exporter:
*/1 * * * * root jail_exporter --output.file-path /var/tmp/node_exporter/jail_exporter.prom
node_exporter exposes by default all metrics from files in the directory: /var/tmp/node_exporter/*.prom, this way we achieve the same result as with the service but we had to install additional software.
If we have chosen RC, we must add a scrape to the Prometheus configuration. If we have used the TextCollector, we can skip this part:
...
scrape_configs:
...
  - job_name: 'prometheus_jail_exporter'
    scrape_interval: 30s
    static_configs:
      - targets: ['mightymax:9452']
    basic_auth:
      username: jail_exporter_user
      password: PASSWORD
...
Restart the service:
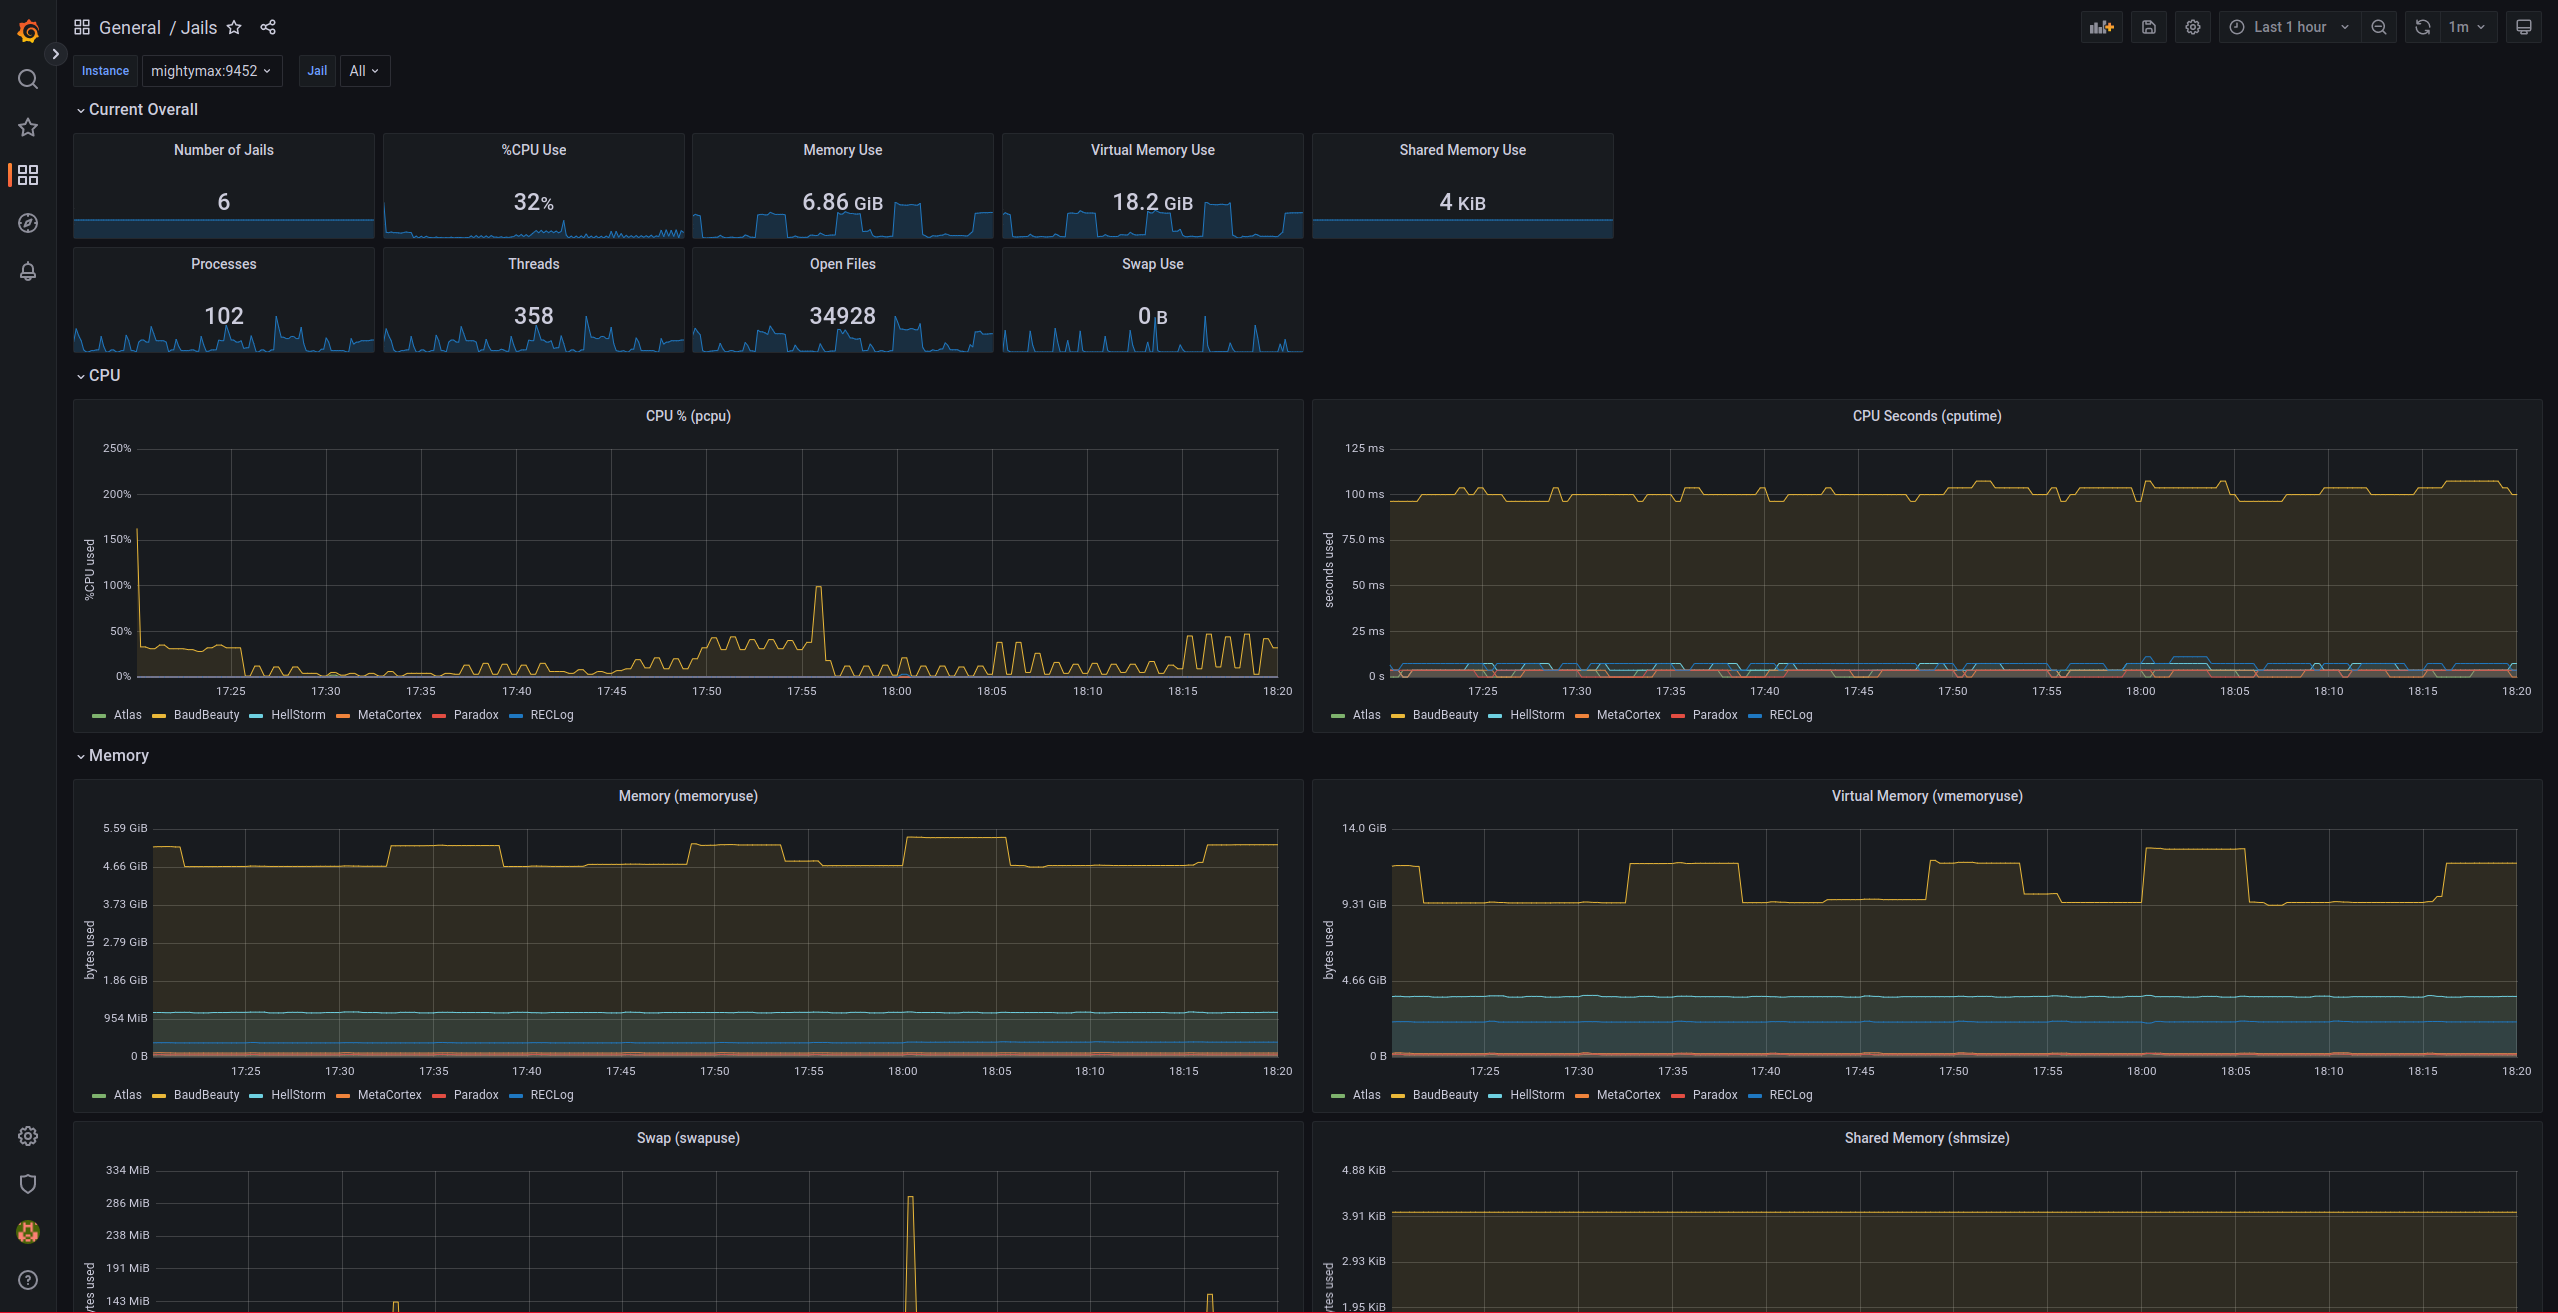
To be able to visualize the metrics, we must import the
Grafana dashboard: