It is recommended to read the previous articles to better understand the current one:
- GameBoy Dev00
- GameBoy Dev01
- GameBoy Dev02
- GameBoy Dev03
- GameBoy Dev04
- GameBoy Dev05
- GameBoy Dev06
- GameBoy Dev07
- GameBoy Dev08
Debugging the code of our game is not always easy. There are times when it will behave erratically without an obvious reason. In these cases, having a debugger with which we can stop the program execution at a given point, see the value of the variables, and advance step by step is priceless.
In the first article of the GameBoy Dev series, we already explained how to run ROMs in Emulicious. This time, we will go one step further by integrating the Visual Studio Code IDE to be able to run our code in a controlled way. To do this, we start the emulator and enable remote debugging.
We start Emulicious:
We enable remote debugging:
Tools -> Remote Debugging -> Enabled
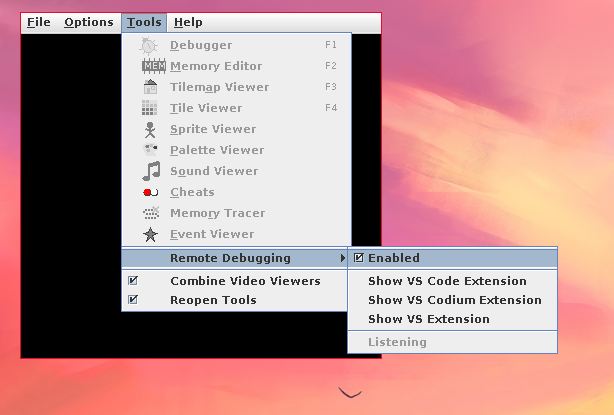
We can see that a socket is listening:
USER     COMMAND    PID   FD PROTO  LOCAL ADDRESS         FOREIGN ADDRESS       PATH STATE   CONN STATE
kr0m     java       61884 42 tcp46  *:58870               *:*                                LISTEN
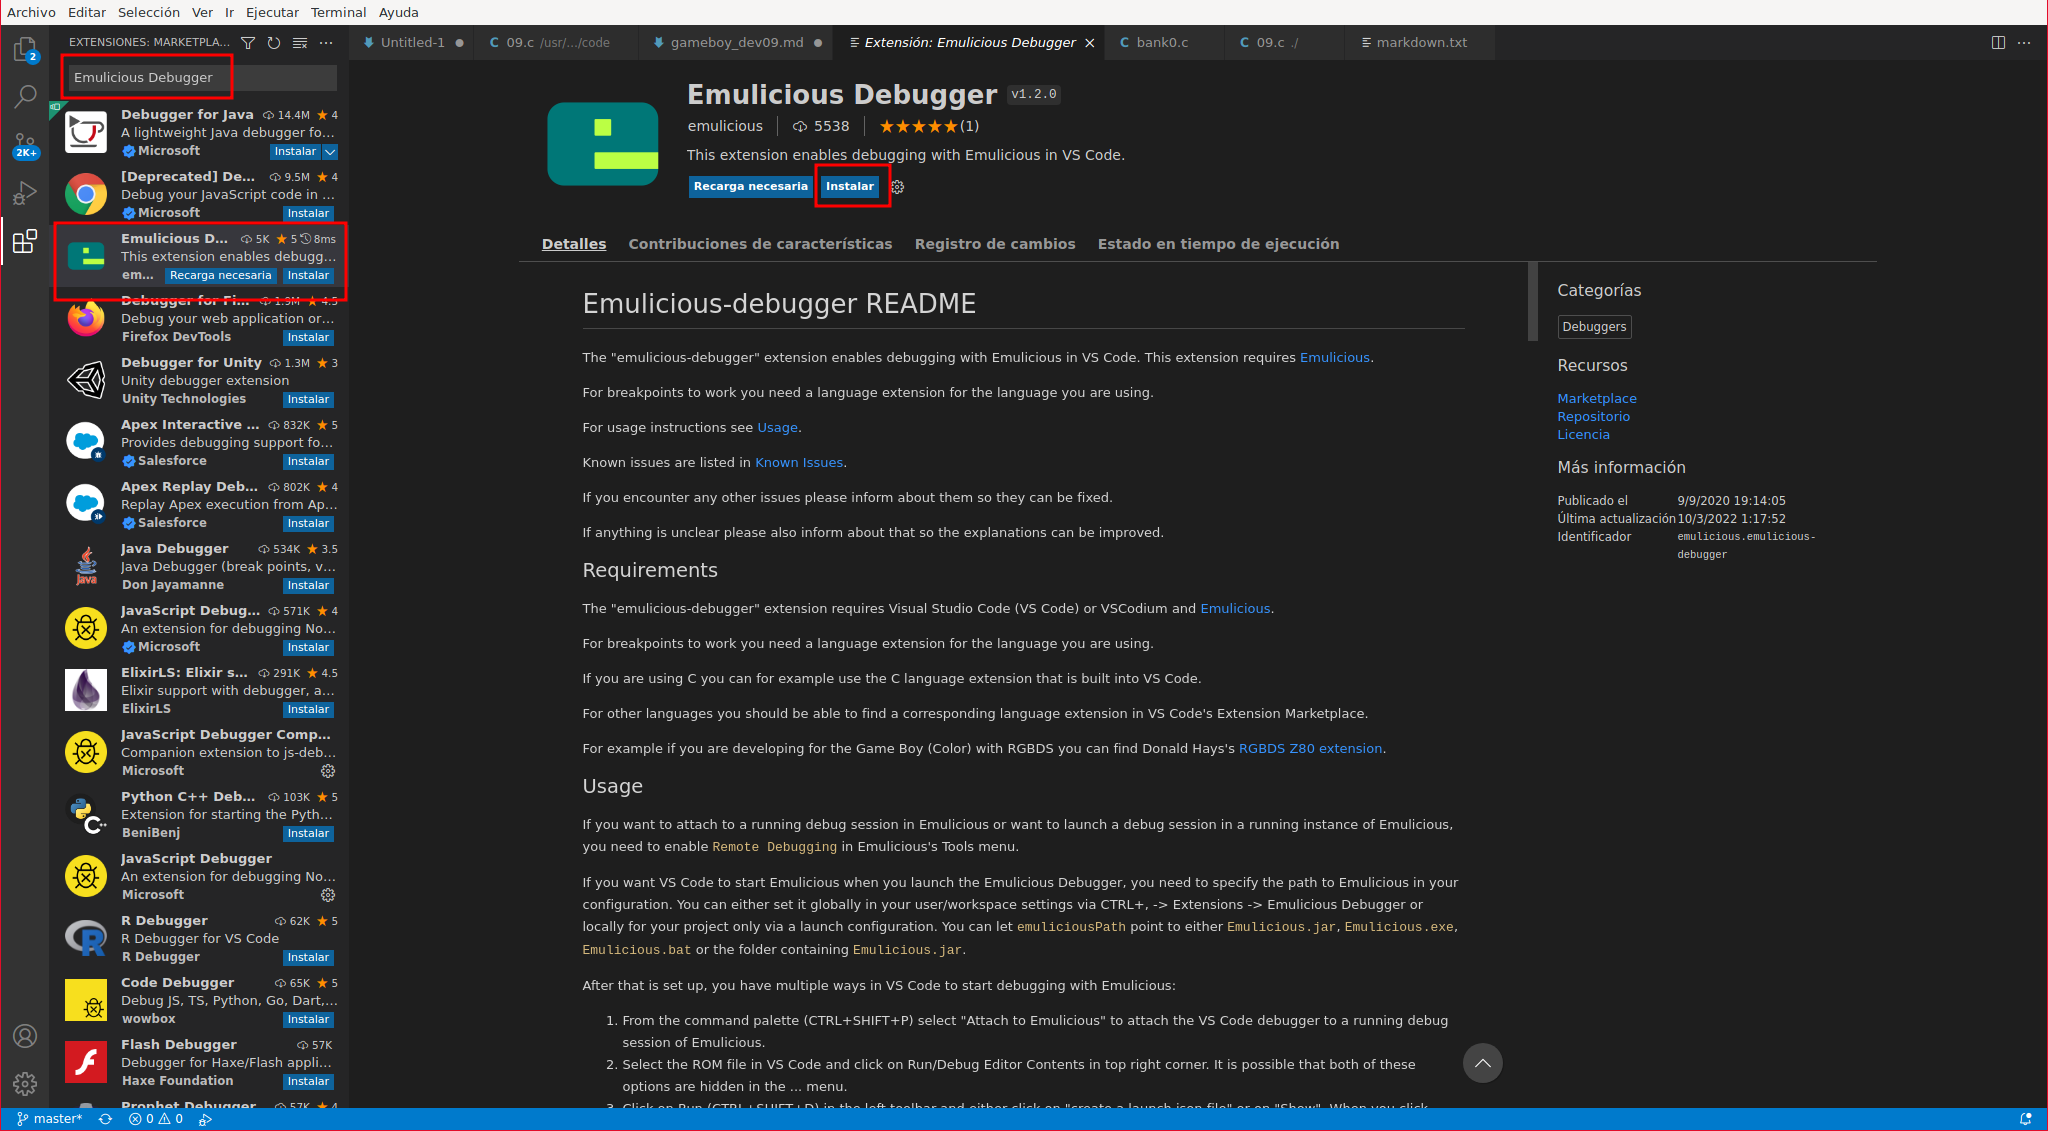
We install the VisualStudioCode extension:
https://marketplace.visualstudio.com/items?itemName=emulicious.emulicious-debugger
We can do everything from VisualStudioCode itself:
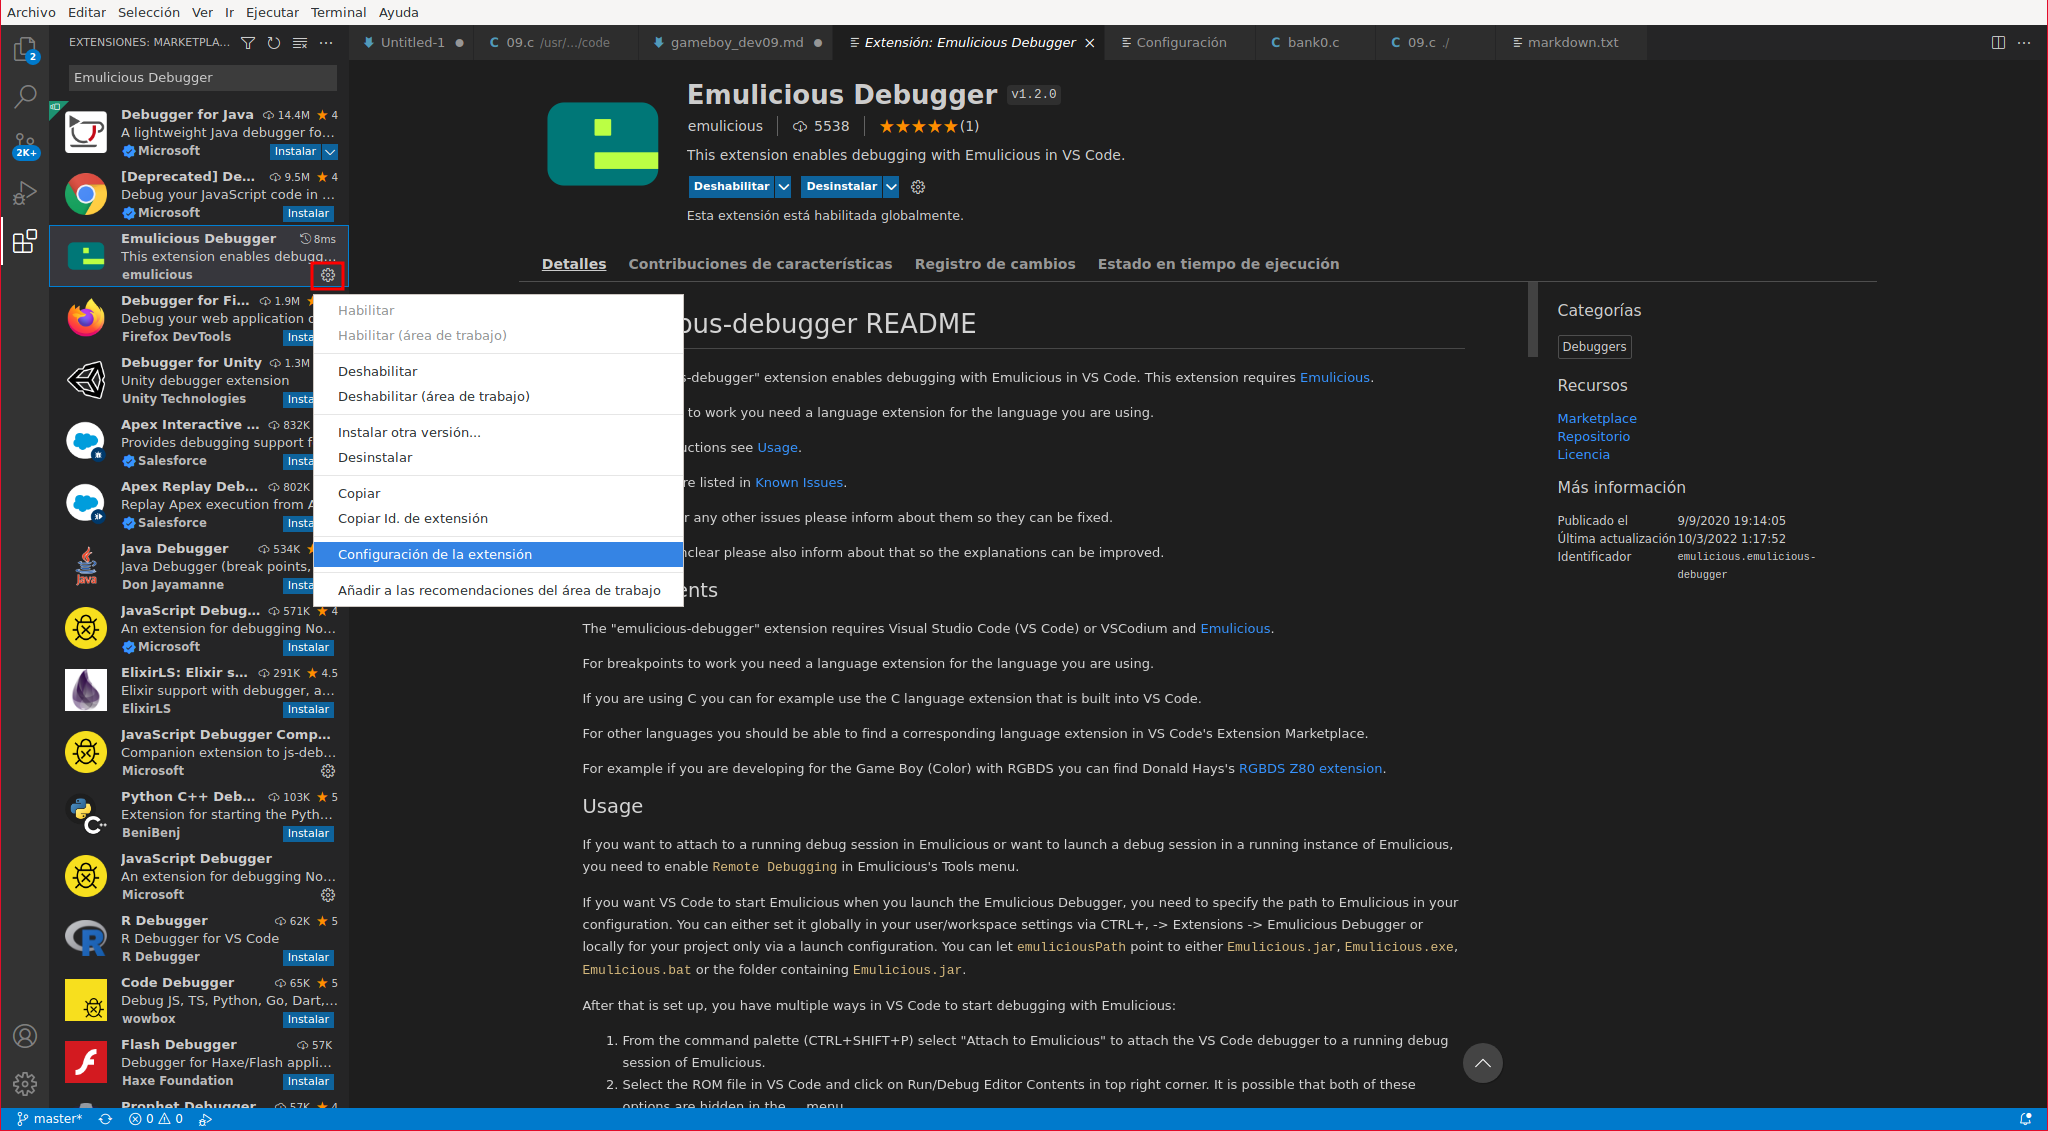
Once installed, we must configure the path where Emulicious is located and the Java binary of our system. To do this, we click on the gear icon and select the extension settings:
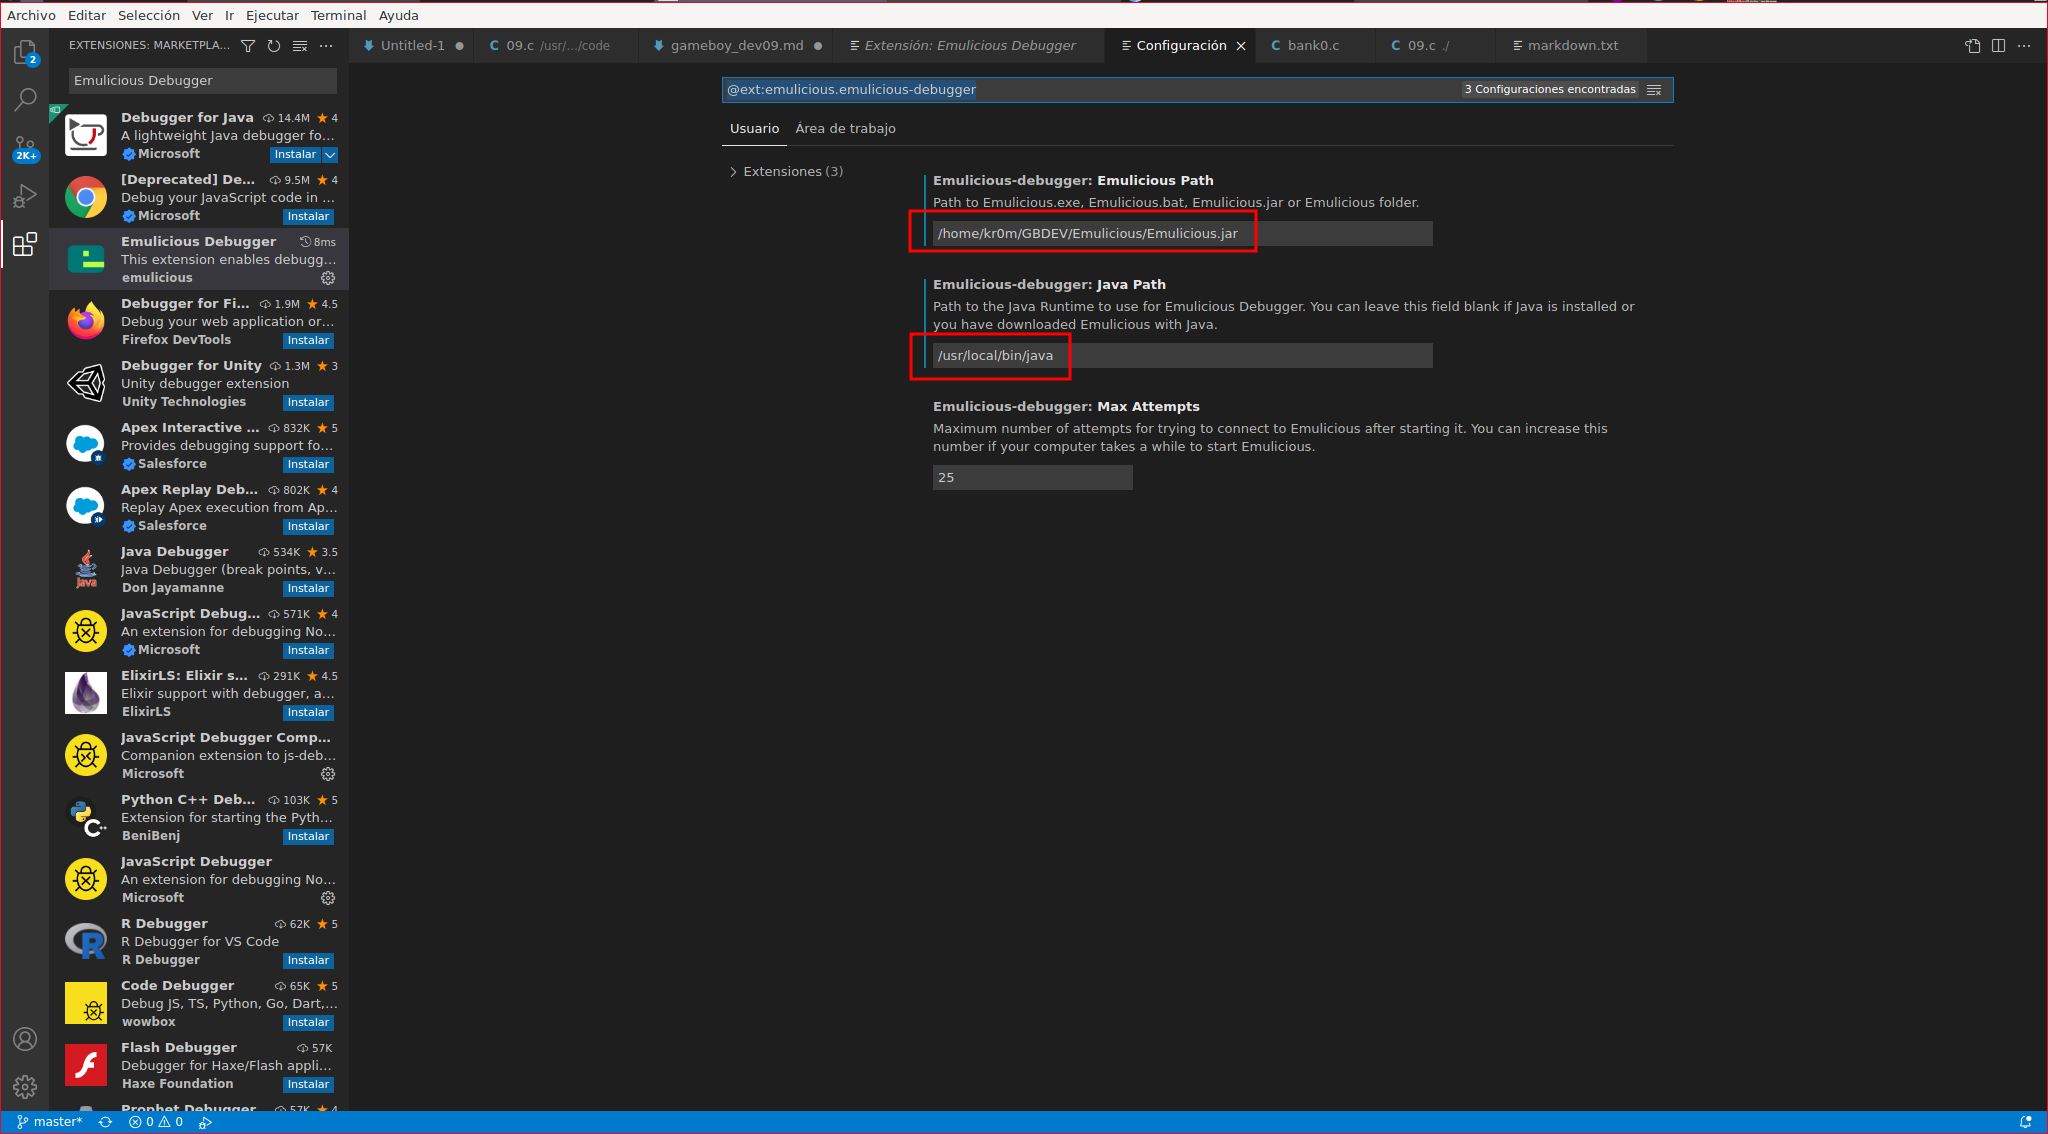
We configure the paths:
To debug the program, it must be compiled with certain options, depending on the option, it must be enabled in a step of the binary generation or another:
-Wa -> Parámetros del assembler
-Wl -> Parámetros del linker
-Wf -> Parámetros del frontend
Therefore, the necessary options are:
-Wa-l: Create list file/outfile[.lst]
-Wl-m: Map output generated as (out)file[.map]
-Wf--debug: Turns on --debug for compiler, -y (.cdb) and -j (.noi) for linker
-Wl-y: SDCDB Debug output as (out)file[.cdb]
-Wl-w: Wide listing format for map file
We can check all the allowed parameters at this link
We compile the latest code in the GameBoyDev series:
GameBoy Dev08
We can see that it has generated some additional files:
08.c 08.cdb 08.gb 08.map
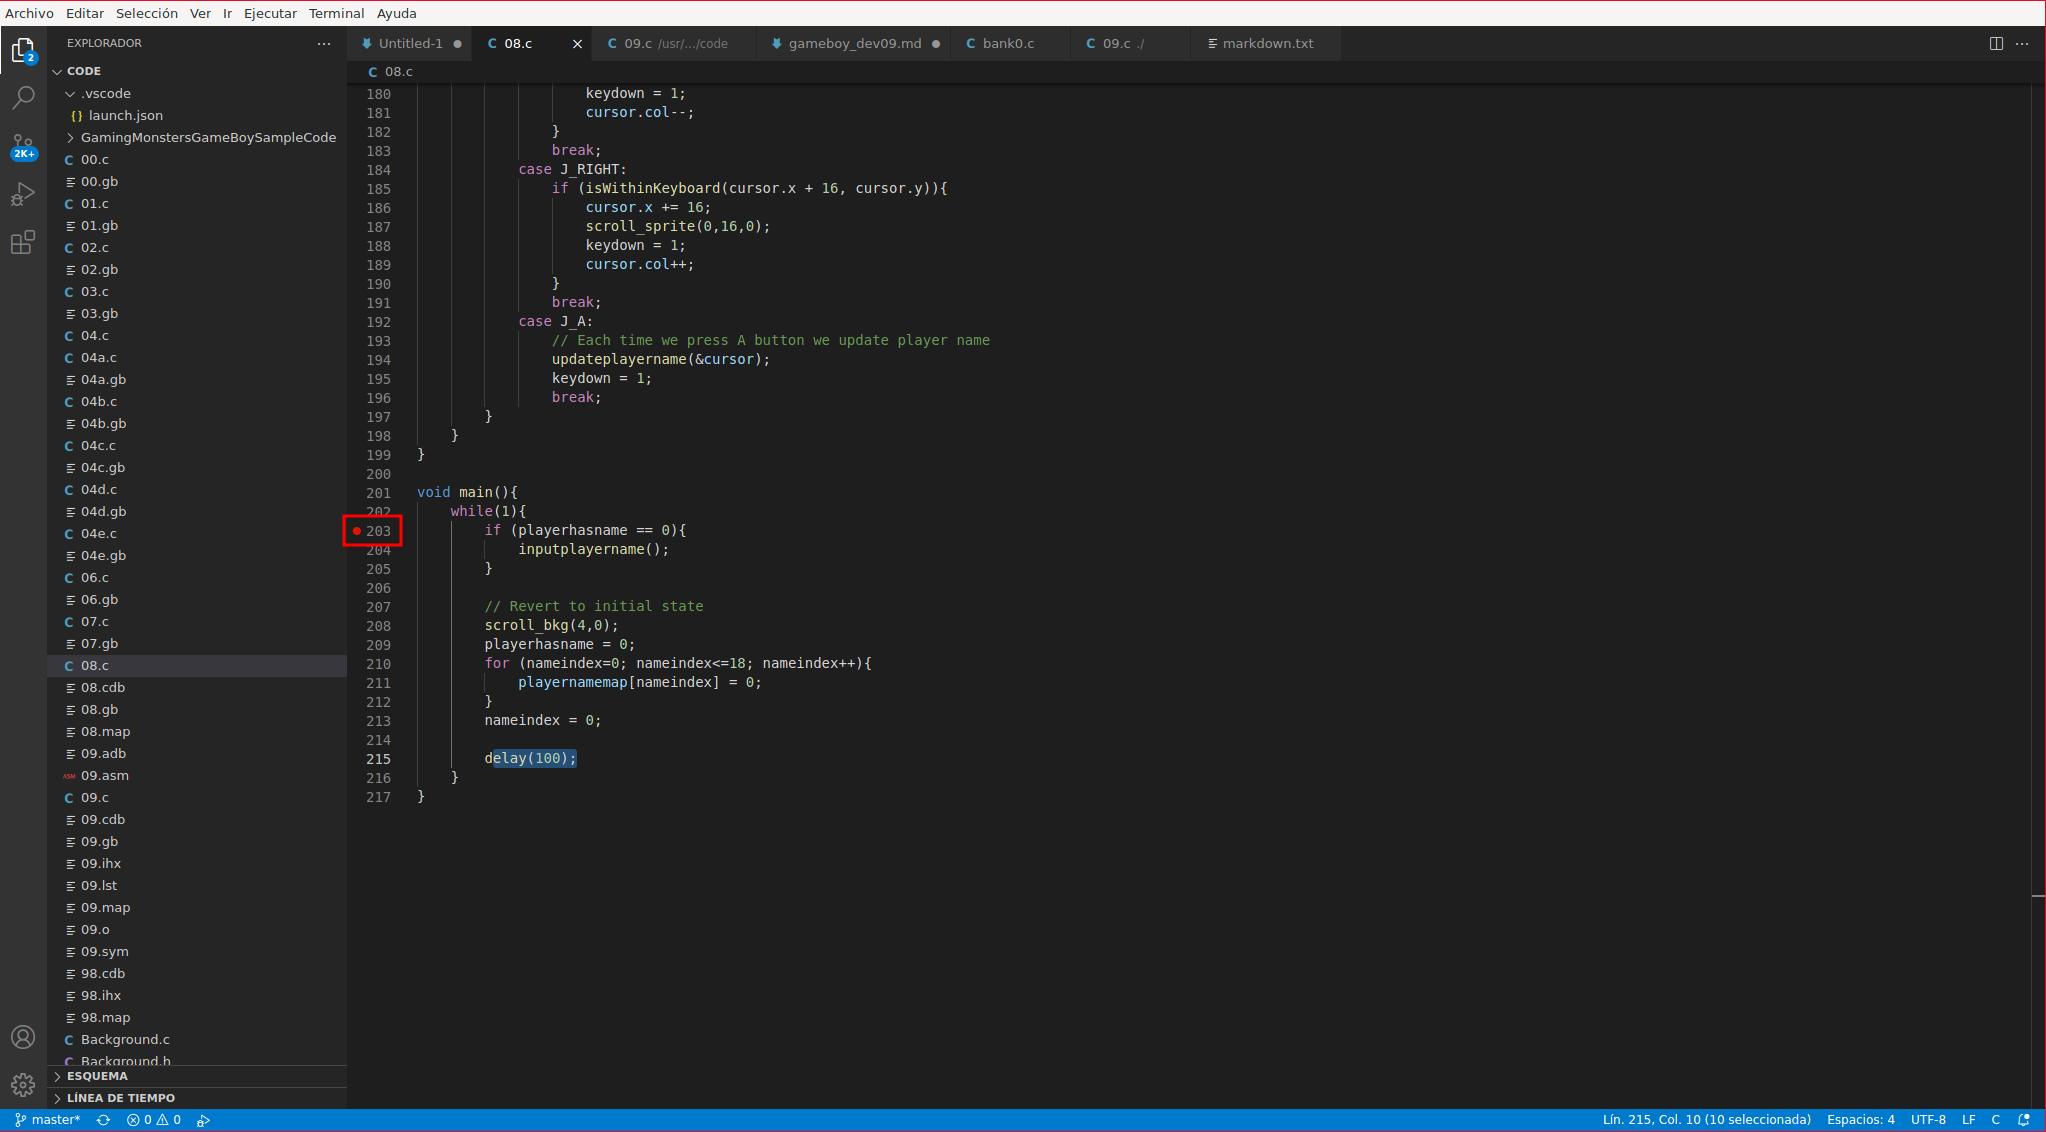
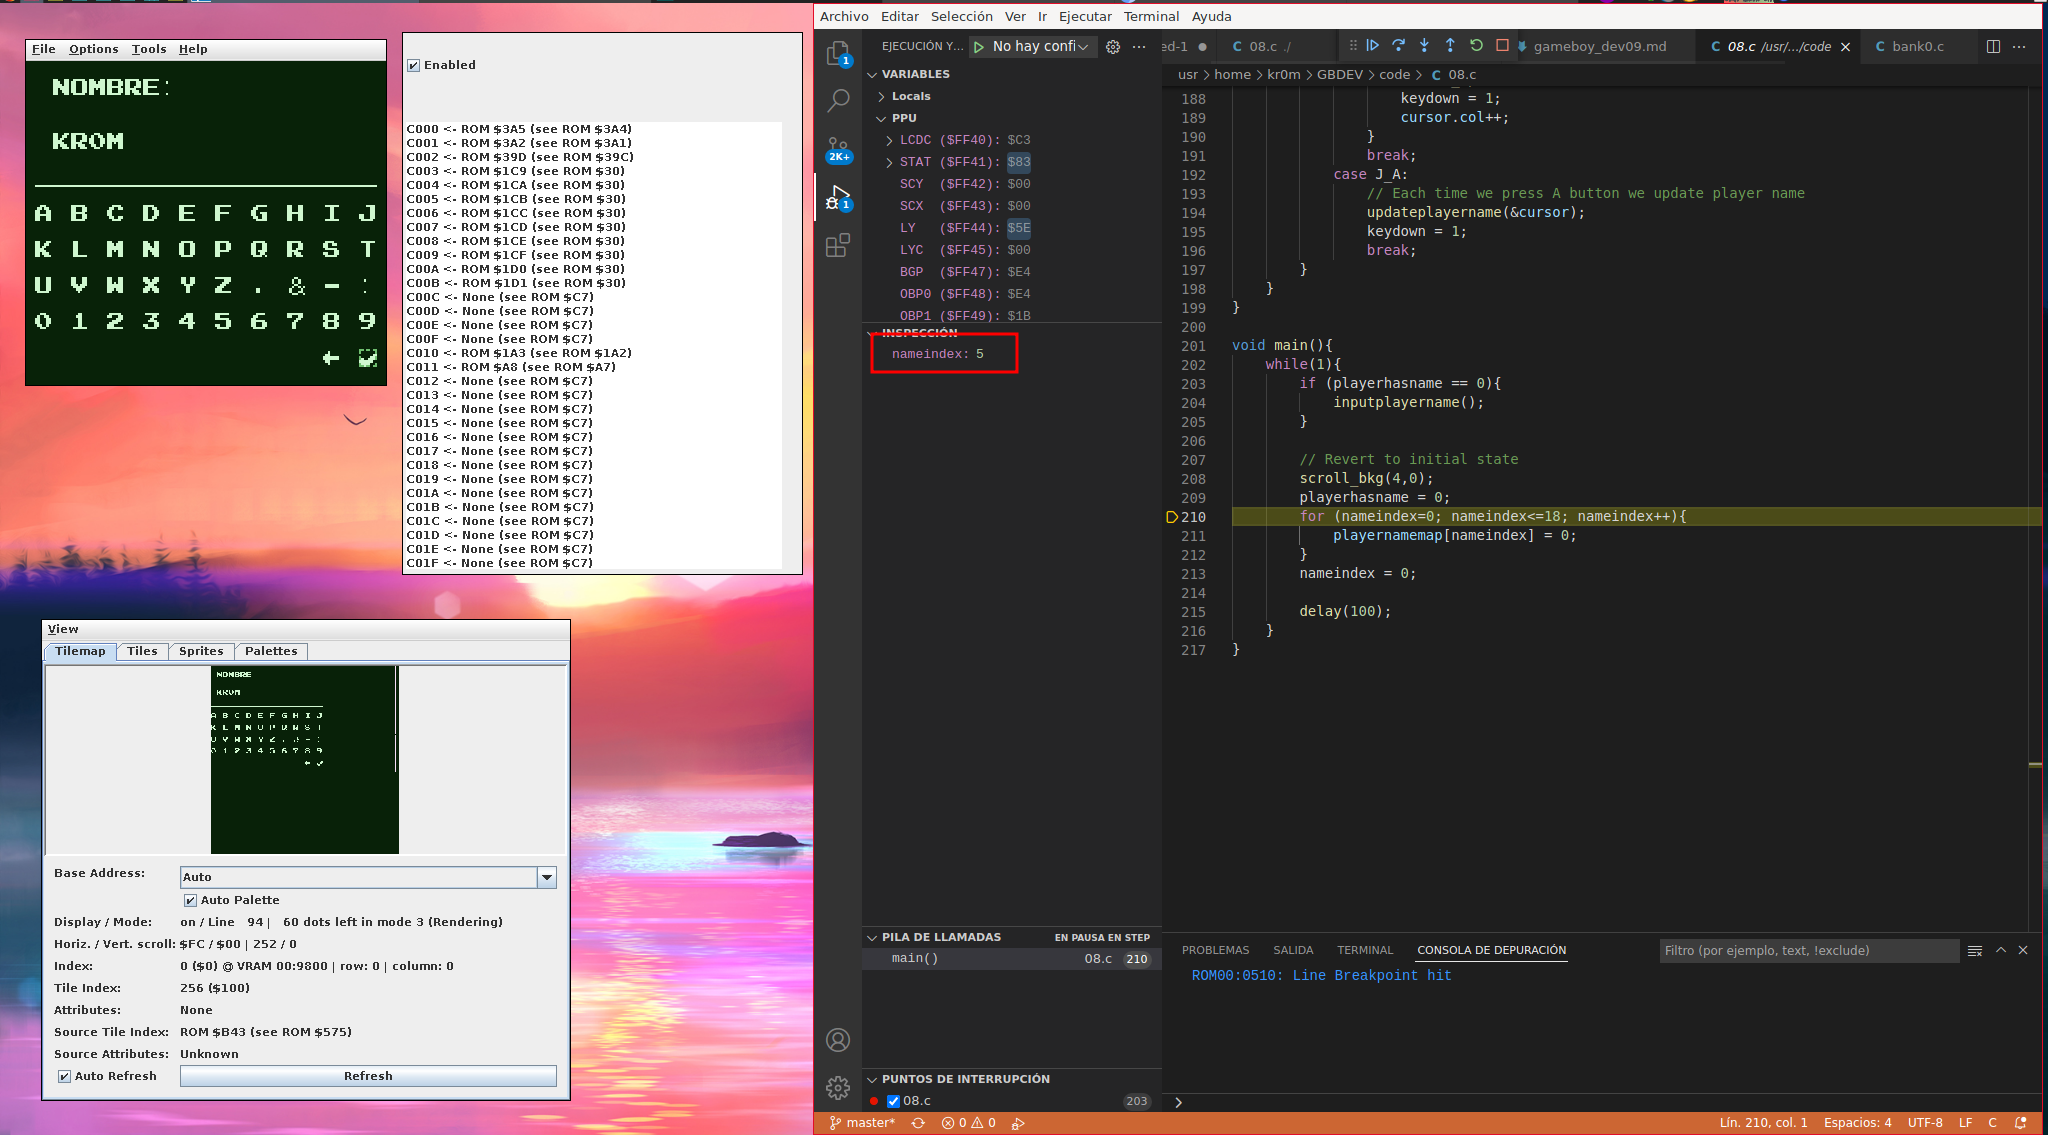
We put a BreakPoint in the source code, a red dot to the left of the line number where we want to interrupt the execution.
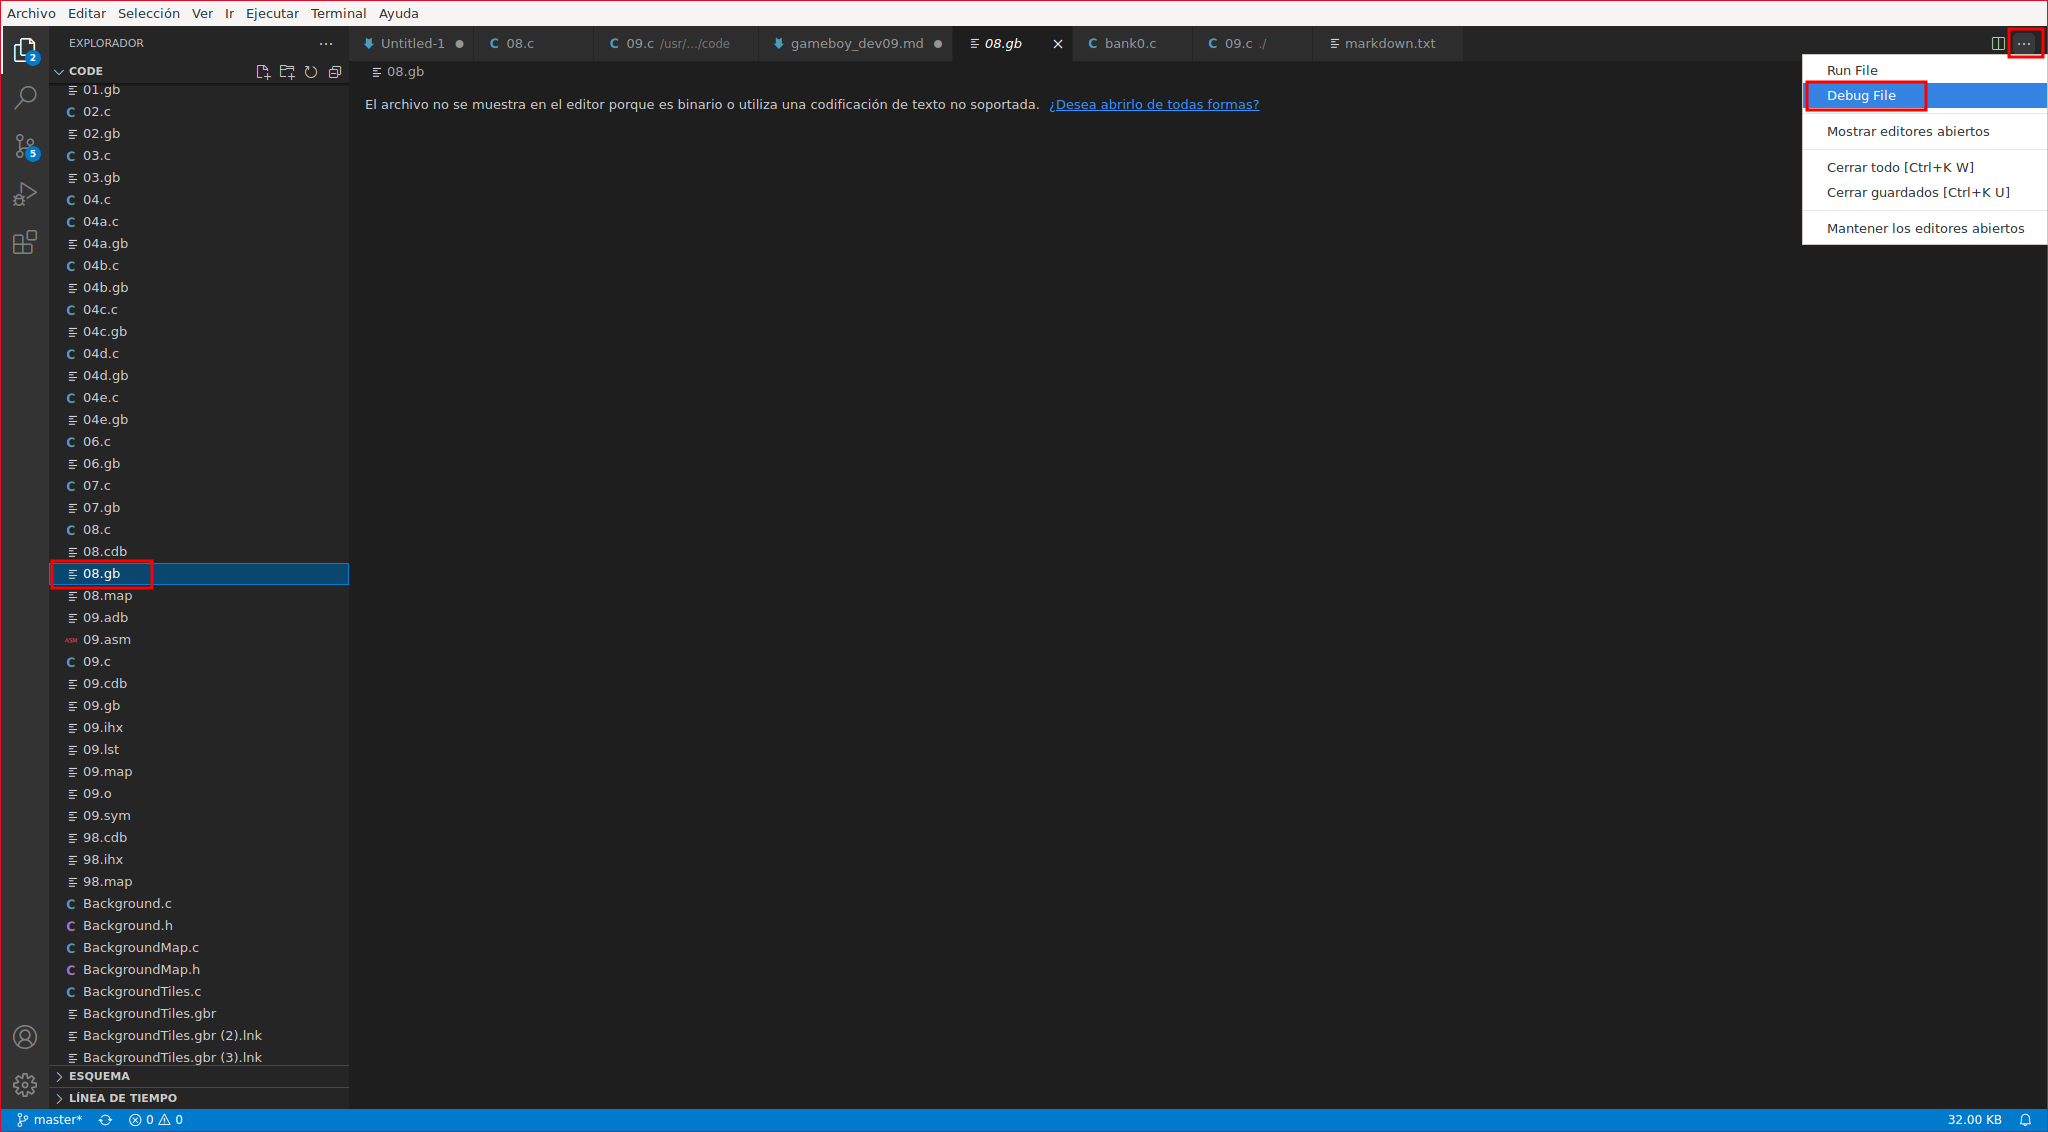
To run it, we click on 08.gb, at the top right of the editor -> … -> Debug file
It will stop at the BreakPoints and we can see the value of the variables by hovering over them.
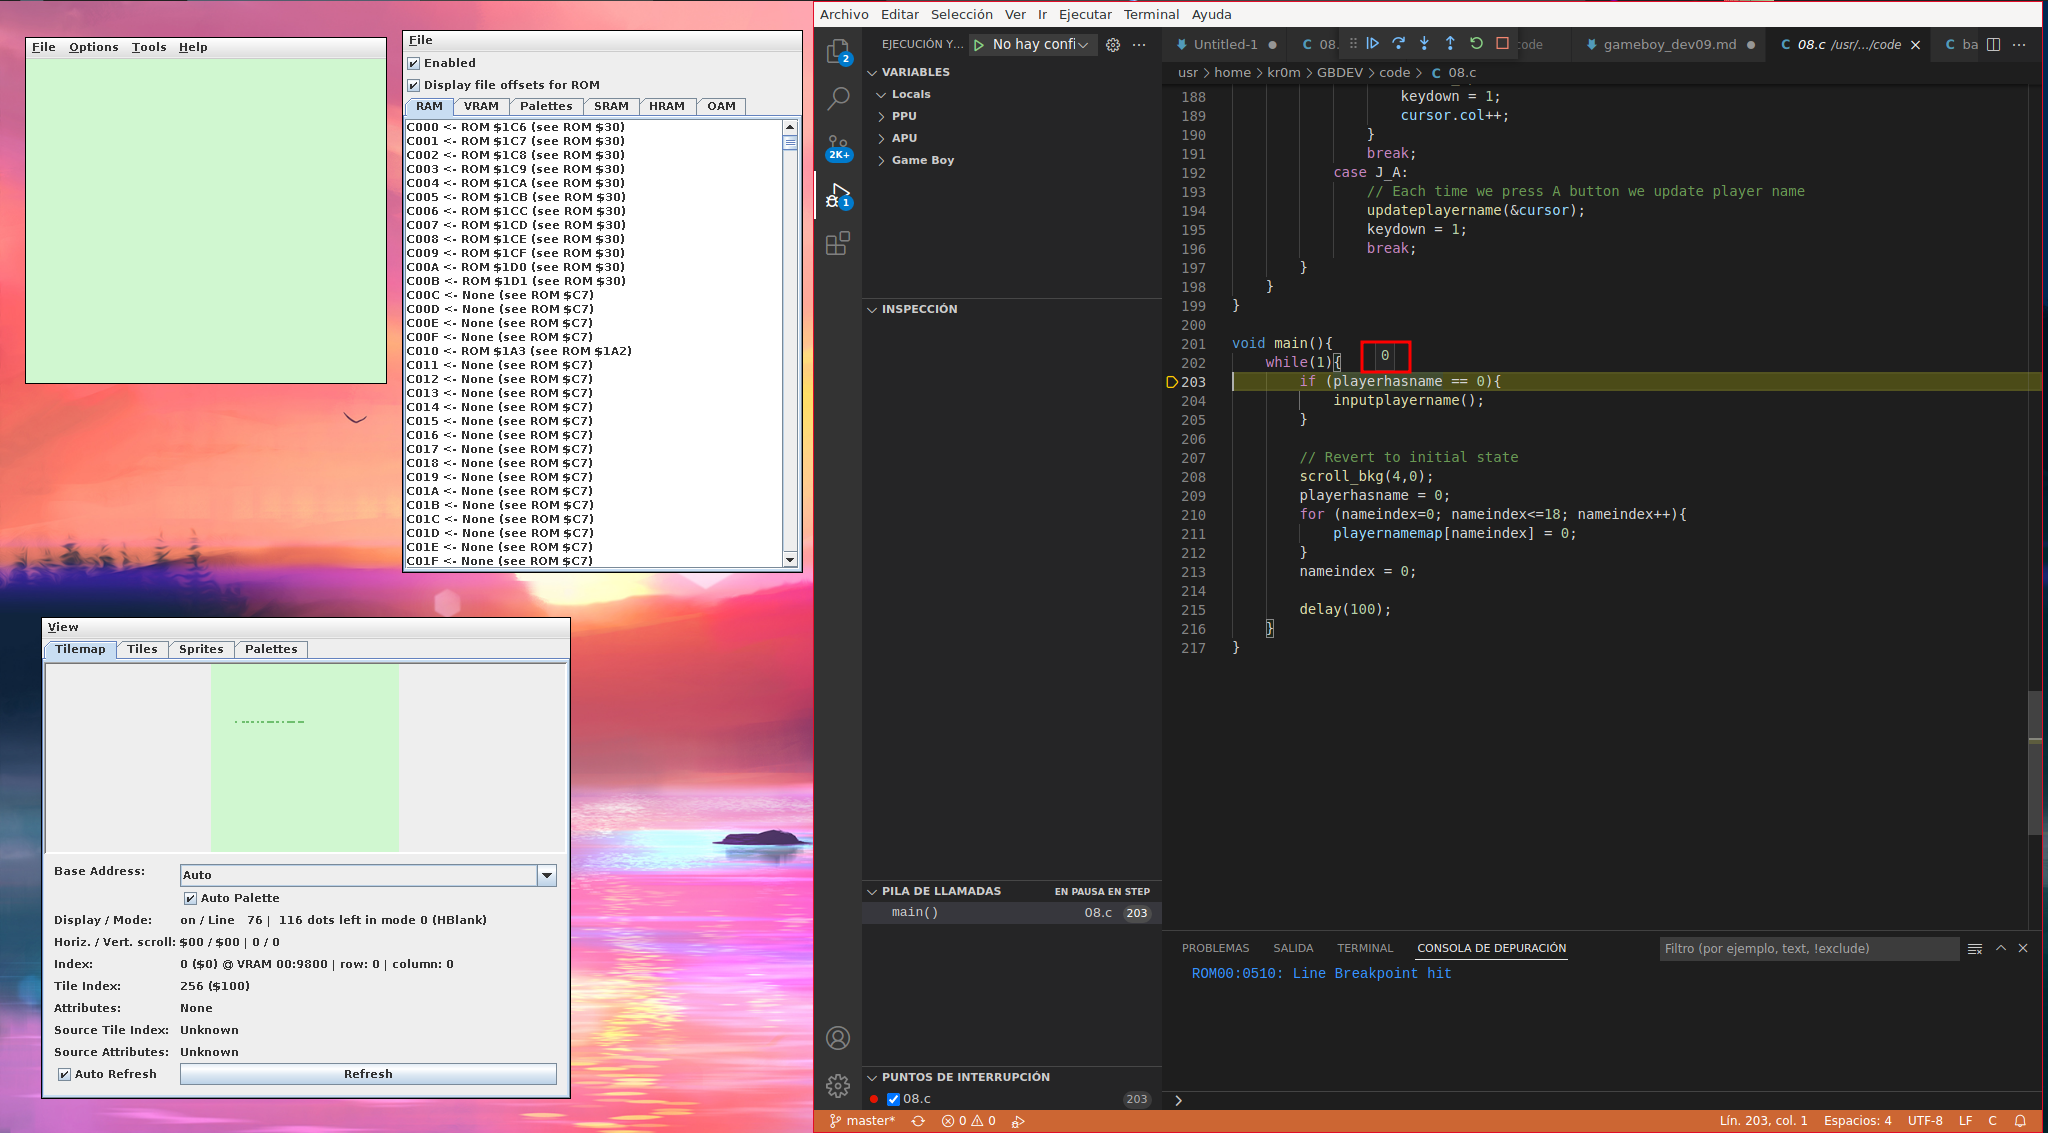
We can also execute the code step by step:
F10 -> Step by step but without entering the called functions
F10 -> Step by step entering the called functions
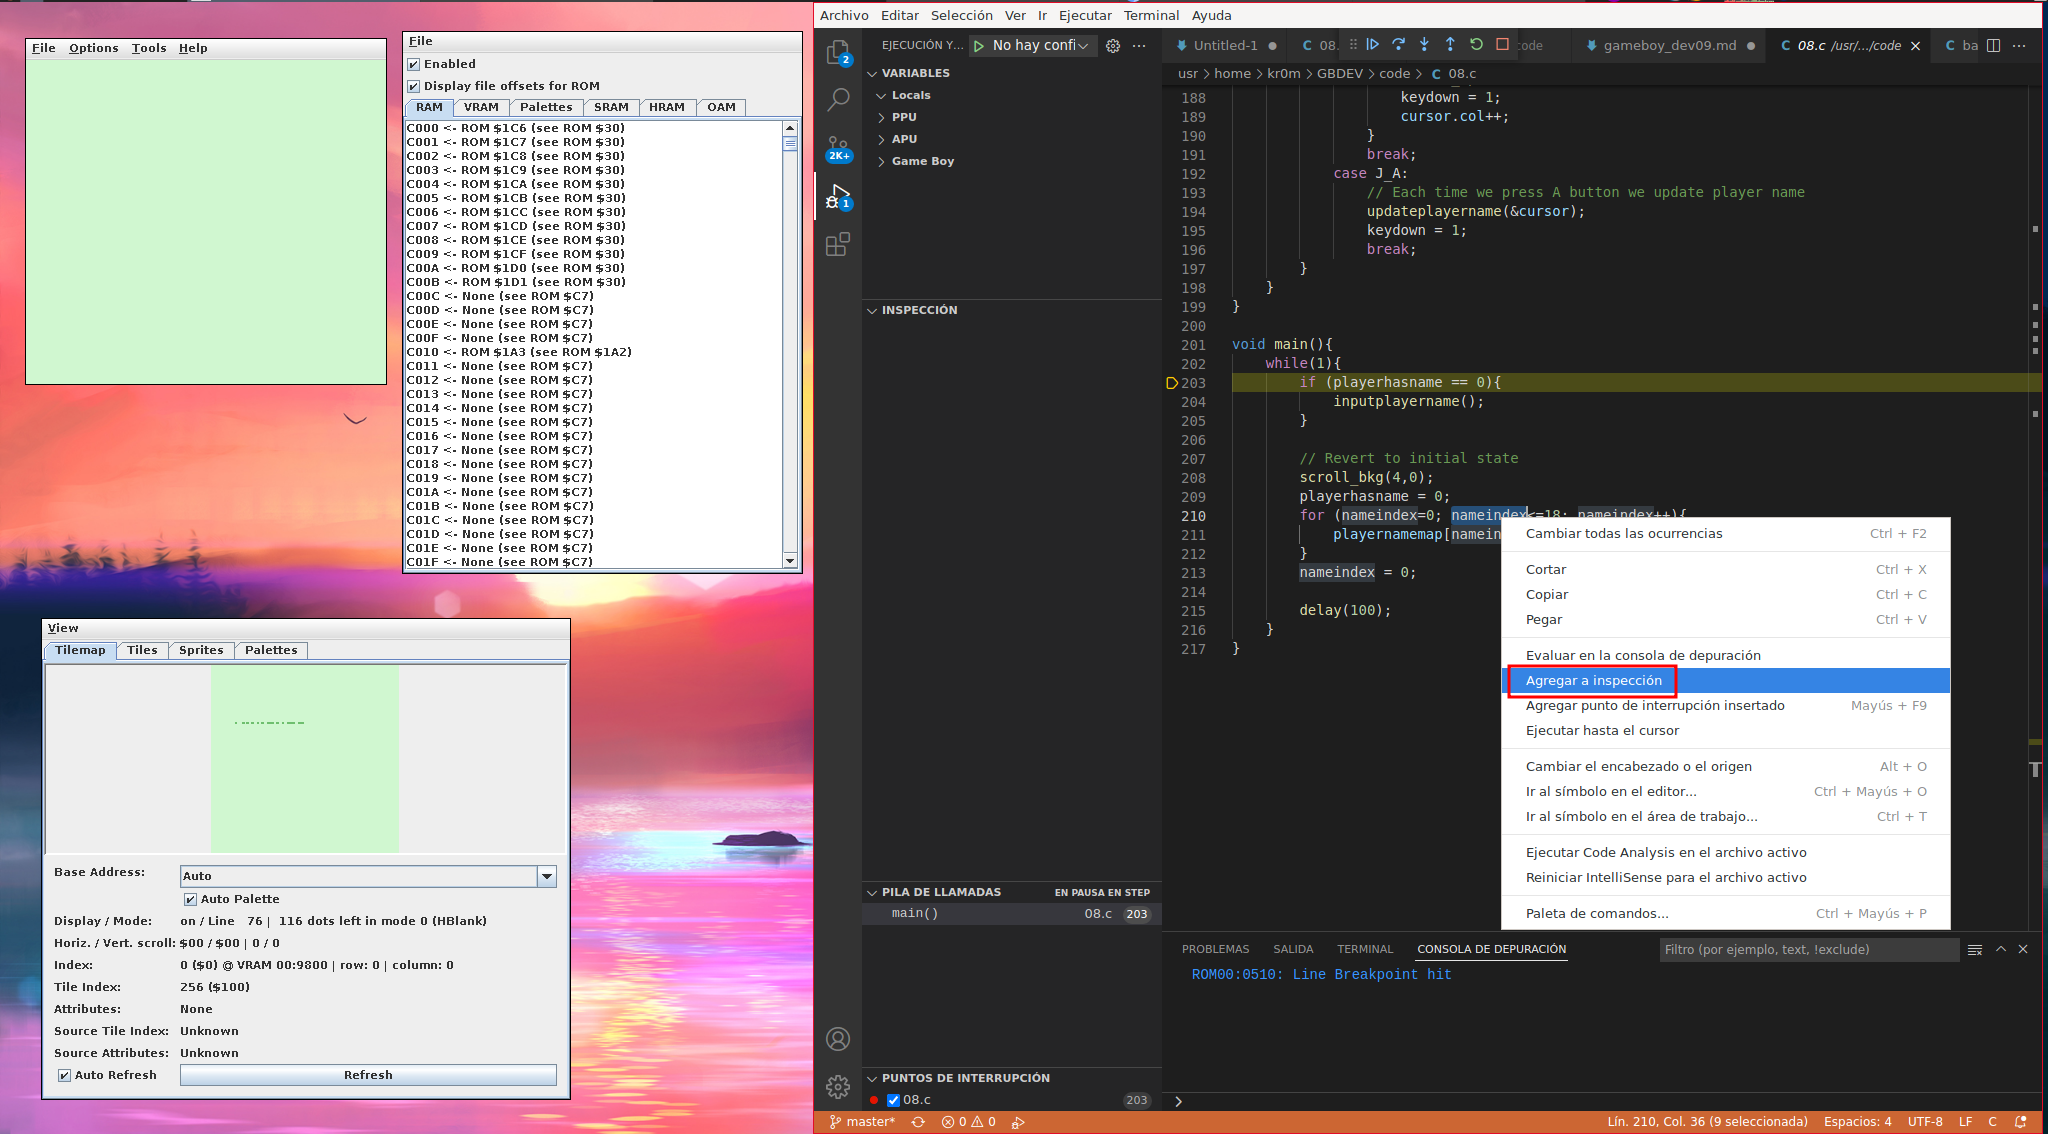
We can also monitor the value of a variable by selecting it -> Add to watch.
|
|
I leave a video where its operation will be seen more easily:
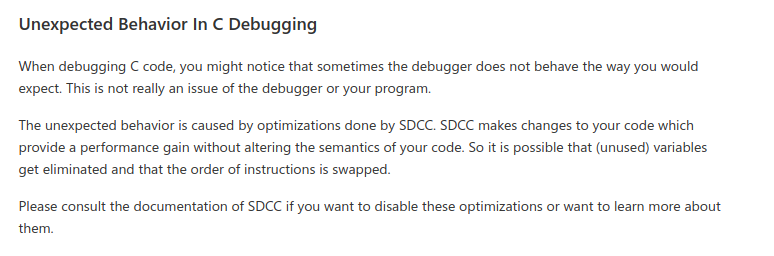
Sometimes, when the C code is executed step by step, it does not behave as we would expect. This is usually due to compiler optimizations, as mentioned on
the plugin’s own website
:
I have done some tests with the following parameters trying to disable optimizations, but it doesn’t seem to improve:
~/GBDEV/gbdk/bin/lcc -Wf--vc -Wf--debug -Wf--nooverlay -Wf--nogcse -Wf--nolabelopt -Wf--noinvariant -Wf--noinduction -Wf--noloopreverse -Wf--no-peep -Wf--no-reg-params -Wf--no-peep-return -Wf--nolospre -Wf--nostdlibcall -Wa-l -Wa-y -Wl-m -Wl-w -Wl-y 08.c -o 08.gb