Elasticsearch along with Kibana allows us to quickly and easily visualize collected data without the need to program any web interface or similar, which is why we are going to integrate libmodsecurity logs with Elasticsearch. We will be able to see the list of alerts, filter by different fields, and visualize attacks by geolocating them on a map.
The ELK (Elasticsearch Logstash Kibana) infrastructure is divided into four layers:
- Filebeat: Log collector, which can be filebeat or any other, responsible for reading log files and sending them to Logstash.
- Logstash: Receives logs from the collector, processes them, and inserts them into Elasticsearch.
- Elasticsearch: Database where records processed by Logstash are stored.
- Kibana: Web interface for visualizing data stored in Elasticsearch.
NOTE: Strictly speaking, the Logstash server can be dispensable since Filebeat is capable of inserting records directly into Elasticsearch, but through Logstash we can perform more complex data manipulations than just using Filebeat.
Our scenario will consist of a load balancer, a web server that will also serve the Kibana interface and run Filebeat, a Logstash to process the received data, and an Elasticsearch.
We start by compiling haproxy:
We perform a basic configuration where all traffic will be sent to the web server:
defaults
    timeout connect 5000
    timeout client  50000
    timeout server  50000

listen statistics
    bind *:9999
    mode http
    stats enable
    stats hide-version
    stats realm "HaStats"
    stats uri /stats
    stats auth admin:XXXXXXXXX

listen http-in
    bind *:80
    default_backend webnodes

backend webnodes
    mode http
    option forwardfor
    server webserver KIBANASERVER:80
We compile Elasticsearch:
NOTE: The following error may appear:
[1]: max virtual memory areas vm.max_map_count [65530] is too low, increase to at least [262144]
In this case, we adjust the kernel parameter vm.max_map_count:
vi /etc/sysctl.conf
vm.max_map_count = 262144
We configure Elasticsearch to bind to all network interfaces and operate in single-node mode:
network.host: 0.0.0.0
discovery.seed_hosts: []
We start the service:
We add it to the default runlevel:
We filter network traffic so that Elasticsearch can only be accessed from Logstash and Kibana:
iptables -I INPUT 1 -p tcp –dport 9200 -s LOGSTASHSERVER -j ACCEPT
iptables -I INPUT 1 -p tcp –dport 9200 -s KIBANASERVER -j ACCEPT
We save the rules so that they are loaded automatically in case of a restart:
rc-update add sshd default
Now on the web server, we compile Nginx, libmodsecurity, and perform the configuration indicated in this previous article.
On the web server, we will also have Kibana running, so we compile it along with a very useful tool for parsing JSONs:
We indicate to Kibana which Elasticsearch server to connect to. Depending on the boot system we use, we will do it one way or another. In my case, it is OpenRC:
To set a customized Elasticsearch instance:
* OpenRC: set ES_INSTANCE in /etc/conf.d/kibana
* systemd: set elasticsearch.url in /etc/kibana/kibana.yml
ES_INSTANCE=http://ELASTICSEARCHSERVER:9200
Bind Kibana to all interfaces:
server.host: "0.0.0.0"
Start Kibana:
Add the service to the default runlevel:
Check that Kibana starts and can connect to Elasticsearch:
http://KIBANASERVER:5601
Bind it back to localhost by commenting out the line:
#server.host: "0.0.0.0"
Restart the service to apply the new configuration:
Kibana does not have native authentication, so we will use Nginx for it. To generate the hash file, it is necessary to install apache-tools:
Generate the hash file for the user kibanauser:
The Nginx configuration would be as follows:
user nginx nginx;
worker_processes 1;

error_log /var/log/nginx/error_log info;

events {
    worker_connections 1024;
    use epoll;
}

http {
    include /etc/nginx/mime.types;
    default_type application/octet-stream;

    log_format main
        '$remote_addr - $remote_user [$time_local] '
        '"$request" $status $bytes_sent '
        '"$http_referer" "$http_user_agent" '
        '"$gzip_ratio"';

    client_header_timeout 10m;
    client_body_timeout 10m;
    send_timeout 10m;

    connection_pool_size 256;
    client_header_buffer_size 1k;
    large_client_header_buffers 4 2k;
    request_pool_size 4k;

    gzip off;

    output_buffers 1 32k;
    postpone_output 1460;

    sendfile on;
    tcp_nopush on;
    tcp_nodelay on;

    keepalive_timeout 75 20;
    ignore_invalid_headers on;
    index index.php;

    server {
        listen 0.0.0.0;
        server_name modsecurityTest.alfaexploit.com;

        access_log /var/log/nginx/modsecurityTest.access_log main;
        error_log /var/log/nginx/modsecurityTest.error_log info;

        root /var/www/modsecurityTest/;
        location ~* \.php$ {
            fastcgi_index   index.php;
            fastcgi_pass    127.0.0.1:9000;
            include         fastcgi_params;
            fastcgi_param   SCRIPT_FILENAME    $document_root$fastcgi_script_name;
            fastcgi_param   SCRIPT_NAME        $fastcgi_script_name;
        }
    }
    server {
        listen 8080 default_server;
        listen [::]:8080 default_server;

        auth_basic "Restricted Access";
        auth_basic_user_file /etc/nginx/htpasswd.users;

        index index.html index.htm index.nginx-debian.html;

        server_name _;

        location / {
            proxy_pass http://localhost:5601;
            proxy_http_version 1.1;
            proxy_set_header Upgrade $http_upgrade;
            proxy_set_header Connection 'upgrade';
            proxy_set_header Host $host;
            proxy_cache_bypass $http_upgrade;
        }
    }
}
Restart the service:
Check that authentication works:
http://KIBANASERVER:8080
kibanauser
PASSWORD
Now we leave the web server aside to focus on Logstash’s. We compile the software:
In the Logstash configuration, we split the messages to make each [transaction][messages][message] an independent event. If the message is null, we remove the event. Otherwise, alertmessage: [transaction][messages][message]
input {
  beats {
    port => 5044
    host => "0.0.0.0"
  }
}

filter {
  # Split by transaction-messages: The split filter clones an event by splitting one of its fields and placing each value resulting from the split into a clone of the original event
  split {
    field => "[transaction][messages]"
  }

  # Assign attackerip field depending of direct traffic or load balanced
  if ([transaction][request][headers][X-Forwarded-For]) {
    mutate {
      add_field => {
        "attackerip" => "%{[transaction][request][headers][X-Forwarded-For]}"
      }
    }
  } else {
    mutate {
      add_field => {
        "attackerip" => "%{[transaction][client_ip]}"
      }
    }
  }

  # Delete not matched rules messages
  if [transaction][messages][message] == "" {
    drop {}
  } else {
    # Delete anomaly score checks and internal messages
    if [transaction][messages][details][data] == "" {
      drop {}
    } else {
      mutate {
        add_field => {
          "alertmessage" => "%{[transaction][messages][message]}"
        }
        add_field => {
          "alertdata" => "%{[transaction][messages][details][data]}"
        }
        remove_field => [ "[transaction][messages]" ]
      }
    }
  }
  # Geoip: Geoip filter is not supposed to try to populate if the source is a private IP address. It only works on public address.
  geoip { source => "attackerip" }
}

output {
  elasticsearch {
    hosts => "ELASTICSEARCHSERVER:9200"
  }
}
Start the service:
We add it to the default runlevel:
We filter the traffic so that only the web server can send us logs to process:
iptables -I INPUT 1 -p tcp –dport 5044 -s KIBANASERVER -j ACCEPT
We save the rules so that they are loaded automatically in case of a restart:
One way to debug problems in Logstash is to send the output to a JSON format text file. This way we can see if the filters are applied correctly before sending the data to Elasticsearch:
output {
  file {
    codec => "json"
    path => "/tmp/grok.log"
  }
}
We can view the output by passing it through jq:
Another option is to start it manually in foreground so that we can see possible errors:
We just need to install Filebeat on the web server to parse the logs and send them to Logstash. To do this, we make sure that libmodsecurity saves the log files concurrently in the indicated directory:
SecAuditLogType Concurrent
SecAuditLogStorageDir /opt/modsecurity/var/audit
We apply the configuration:
We install Filebeat:
We configure Filebeat to read the files generated by libmodsecurity and send them to Logstash:
filebeat.inputs:
- type: log
  enabled: true
  paths:
    - /opt/modsecurity/var/audit/*/*/*
  json.keys_under_root: true
  encoding: utf-8
  document_type: mod_security
  close_eof: true
  scan_frequency: 5s
  clean_*: true

output.logstash:
  hosts: ["LOGSTASHSERVER:5044"]
We start the service:
We add it to the default runlevel:
We check that it is parsing the indicated files:
2019-11-22T14:42:47.905+0100 INFO log/harvester.go:253 Harvester started for file: /opt/modsecurity/var/audit/20191122/20191122-1339/20191122-133905-157442634521.237997
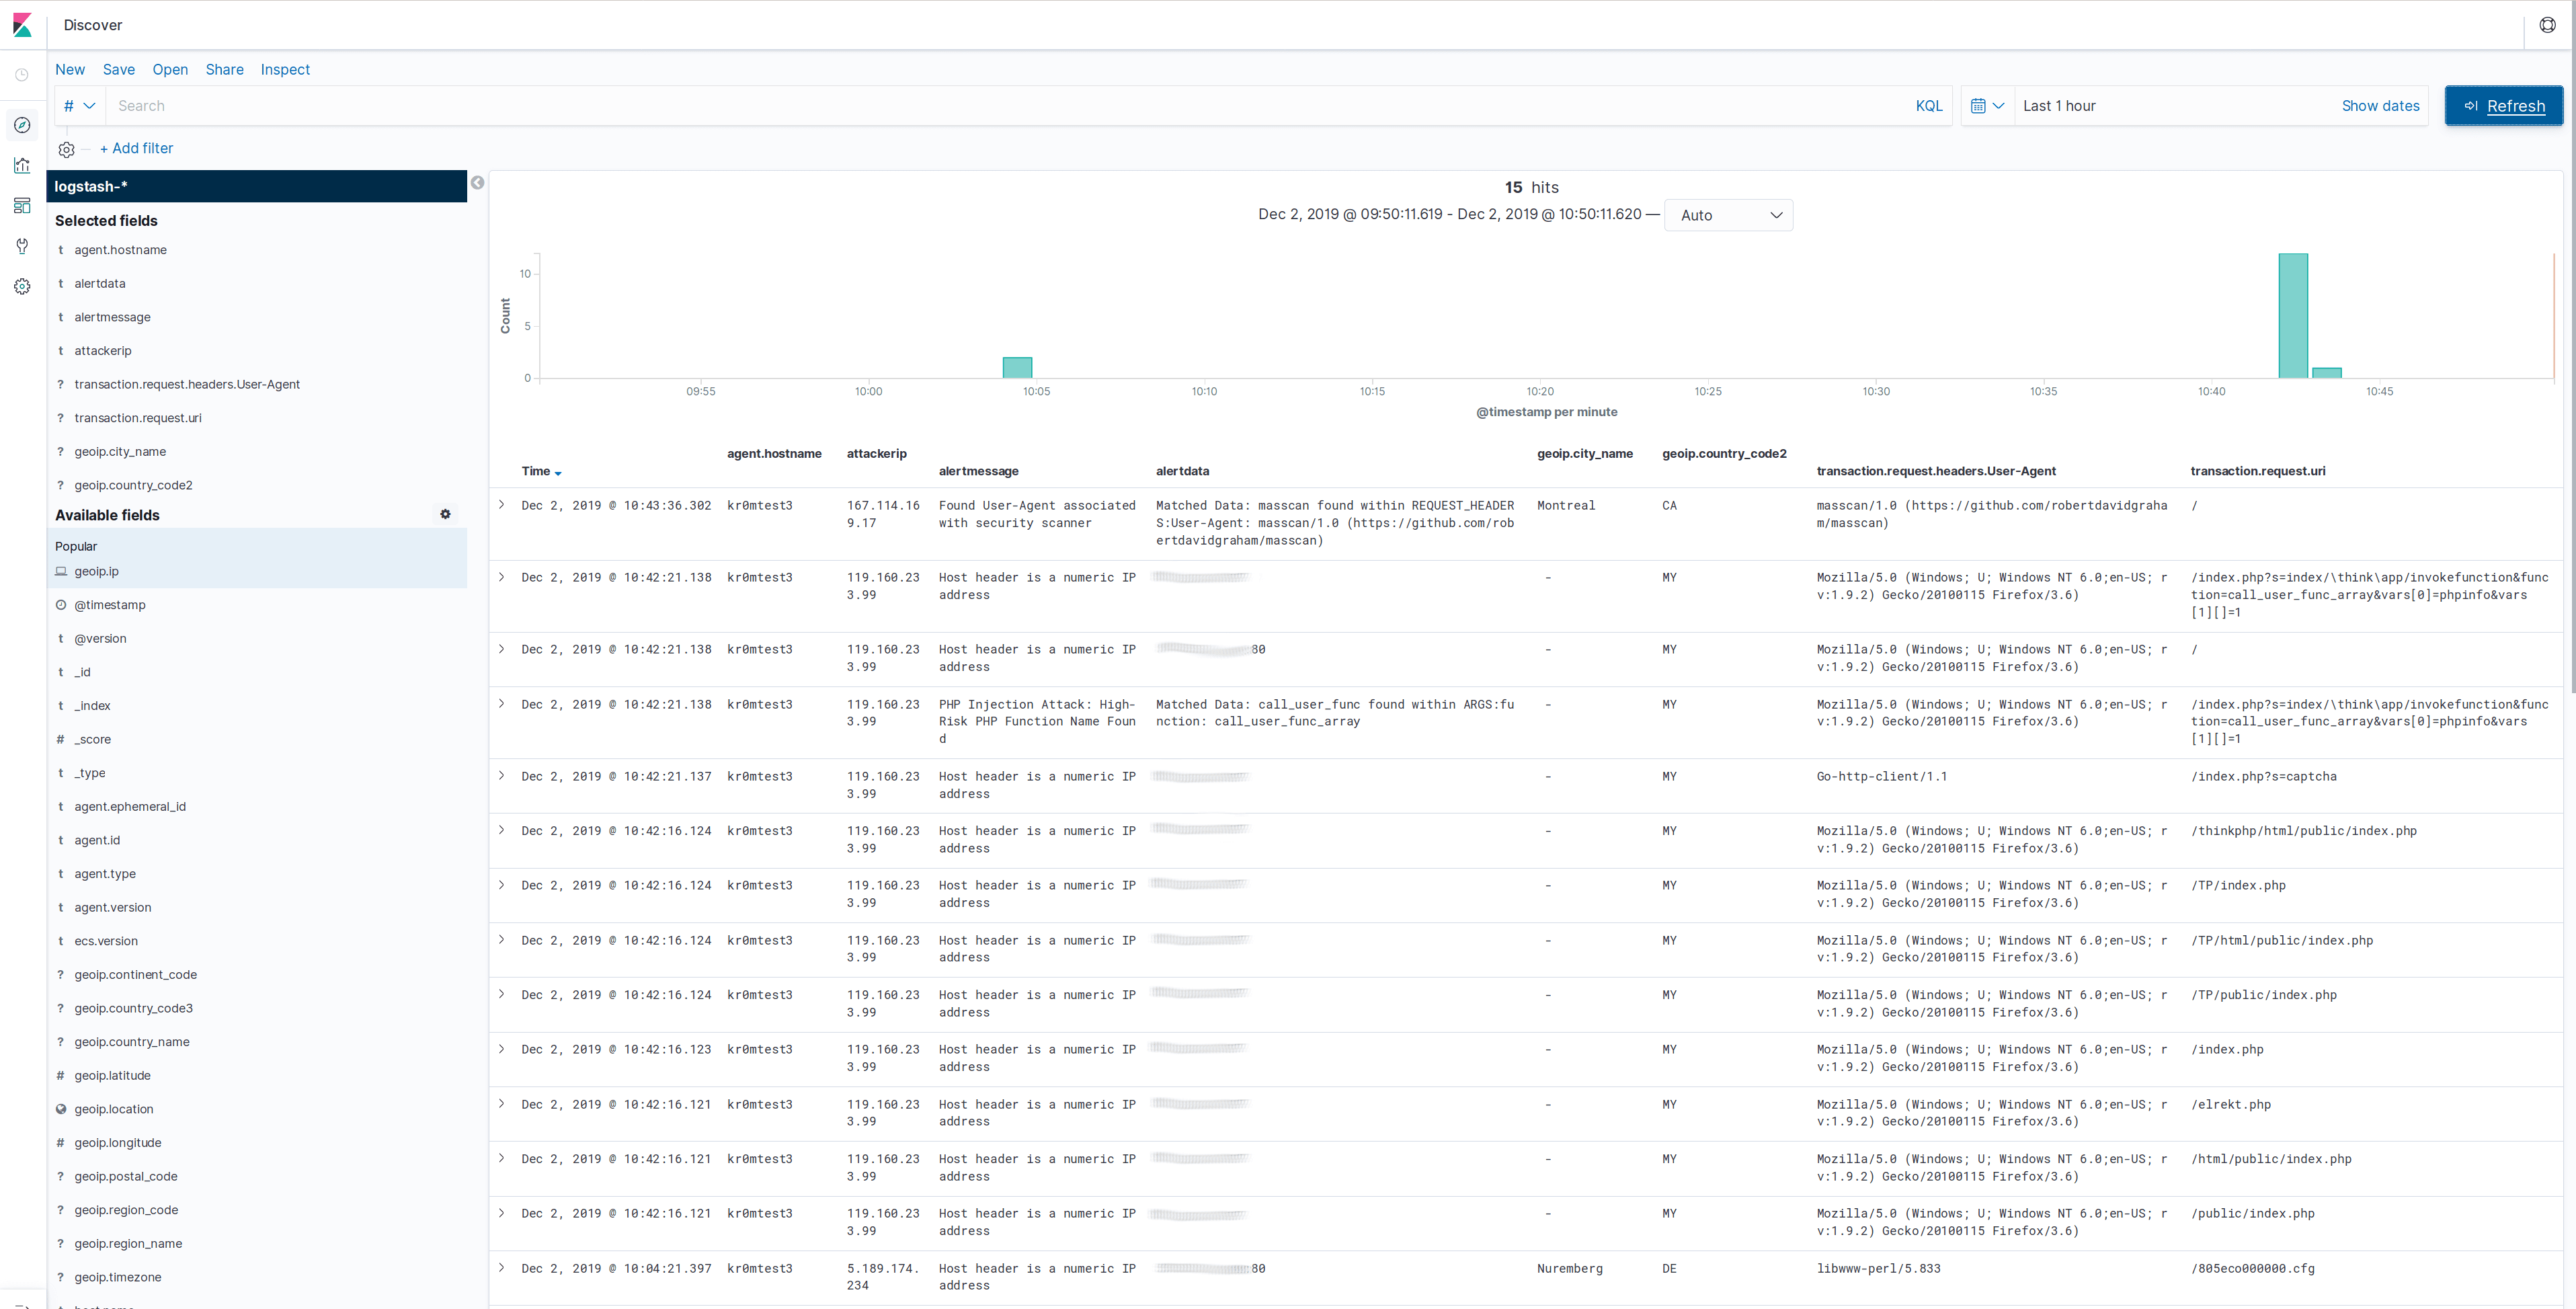
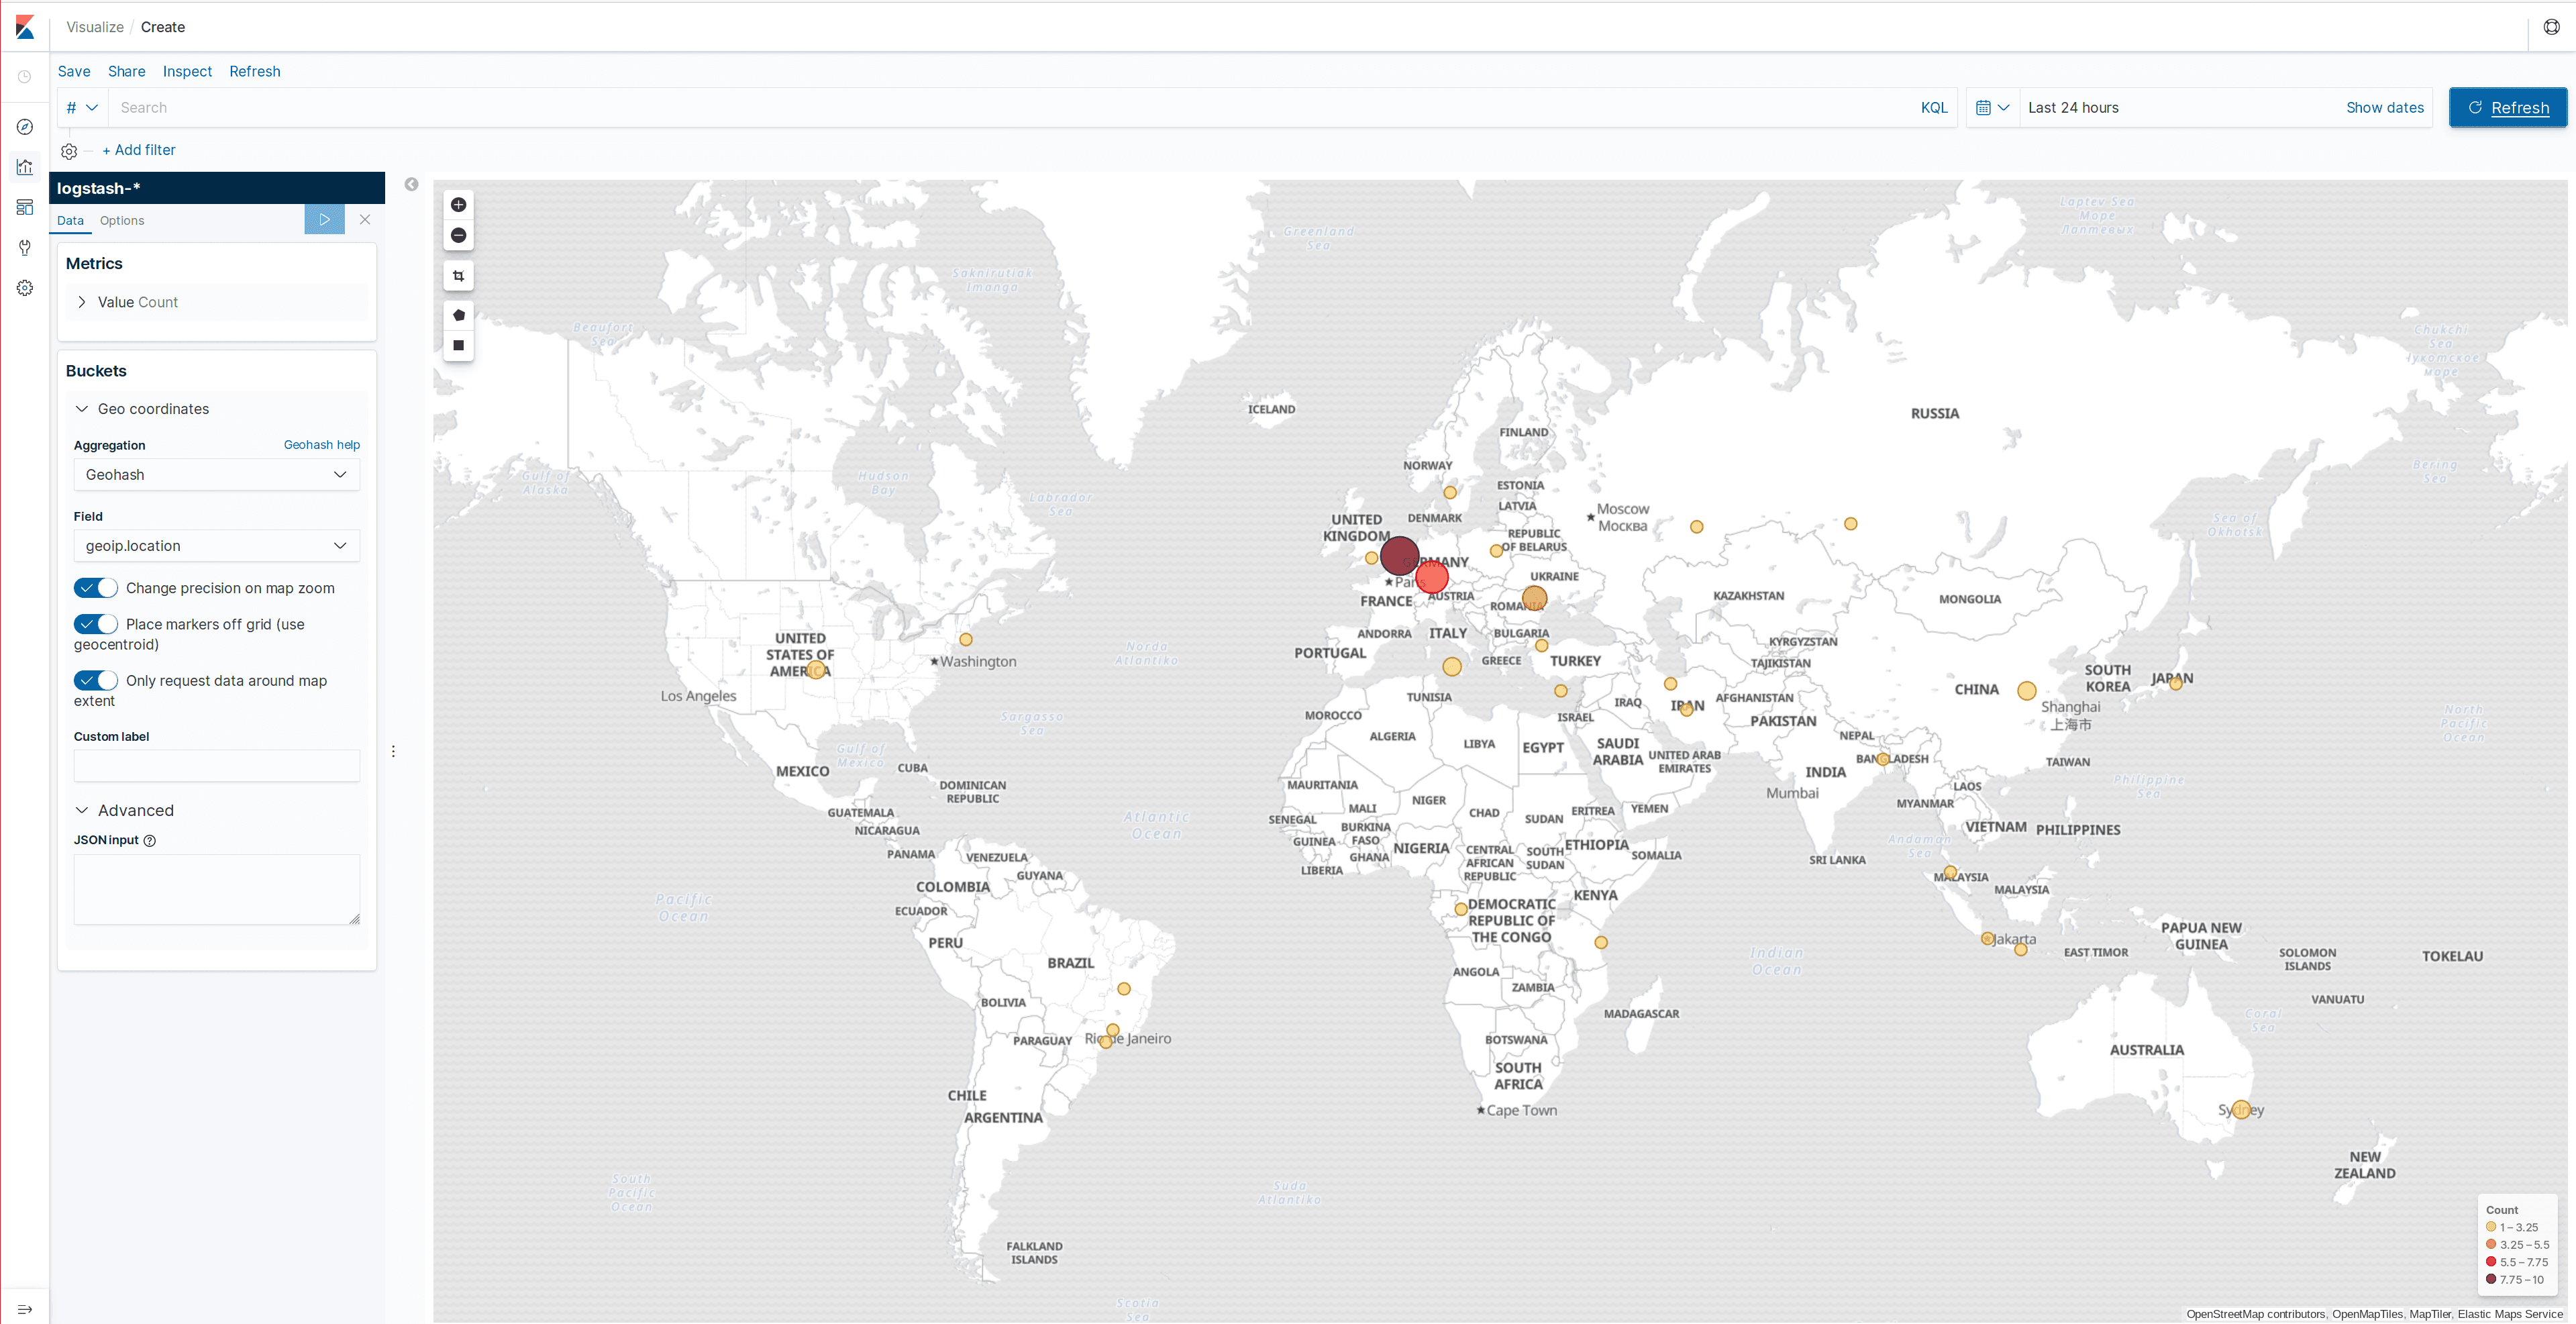
If everything is working correctly, we should be able to visualize the data obtained in Kibana, but first we must generate an index in Elasticsearch. To do this, we access Kibana -> Discover and apply the index pattern logstash-*.
In the following screenshots, we can see some log samples and the geolocation map:
Filebeat can be debugged by starting it manually and indicating that it should show all the messages it is going to publish:
filebeat -e -d "*" -c /etc/filebeat/filebeat.yml