Django Debug Toolbar is a set of panels that display debug information about requests made in the web application, such as used versions, HTTP headers, response times, received signals, cache usage, templates used, analysis of queries made to the database, among other useful information.
Before starting, it is recommended to read the previous articles about Django since they are the previous steps to this article:
- Django: Venv under FreeBSD
- Django: MVT, Apps and URLs
- Django: Database Models
- Django: Administration Interface
- Django: DTL(Django Template Language)
Activate the project’s venv:
source bin/activate
cd rxWodProject/
Install the toolbar:
Make sure to have the ‘django.contrib.staticfiles’ App and add the ‘debugtoolbar’ App, also we must have the STATICURL variable configured:
INSTALLED_APPS = [
    # ...
    'django.contrib.staticfiles',
    'debug_toolbar',
]

STATIC_URL = '/static/'
Enable the toolbar middleware, as mentioned in the documentation the order is important:
The order of MIDDLEWARE is important. You should include the Debug Toolbar middleware as early as possible in the list. However, it must come after any other middleware that encodes the response’s content, such as GZipMiddleware.
MIDDLEWARE = [
    'django.middleware.security.SecurityMiddleware',
    'django.contrib.sessions.middleware.SessionMiddleware',
    'django.middleware.common.CommonMiddleware',
    'django.middleware.csrf.CsrfViewMiddleware',
    'django.contrib.auth.middleware.AuthenticationMiddleware',
    'debug_toolbar.middleware.DebugToolbarMiddleware',
    'django.contrib.messages.middleware.MessageMiddleware',
    'django.middleware.clickjacking.XFrameOptionsMiddleware',
]
Enable access to the toolbar from localhost:
INTERNAL_IPS = [
    '127.0.0.1',
]
Add an extra URL:
import debug_toolbar

from django.contrib import admin
from django.conf import settings
from django.urls import include, path

urlpatterns = [
    path('', include('rxWod.urls')),
    path('', include('usersAuth.urls')),
    path('admin/', admin.site.urls),
    path('__debug__/', include(debug_toolbar.urls)),
]
Start the server:
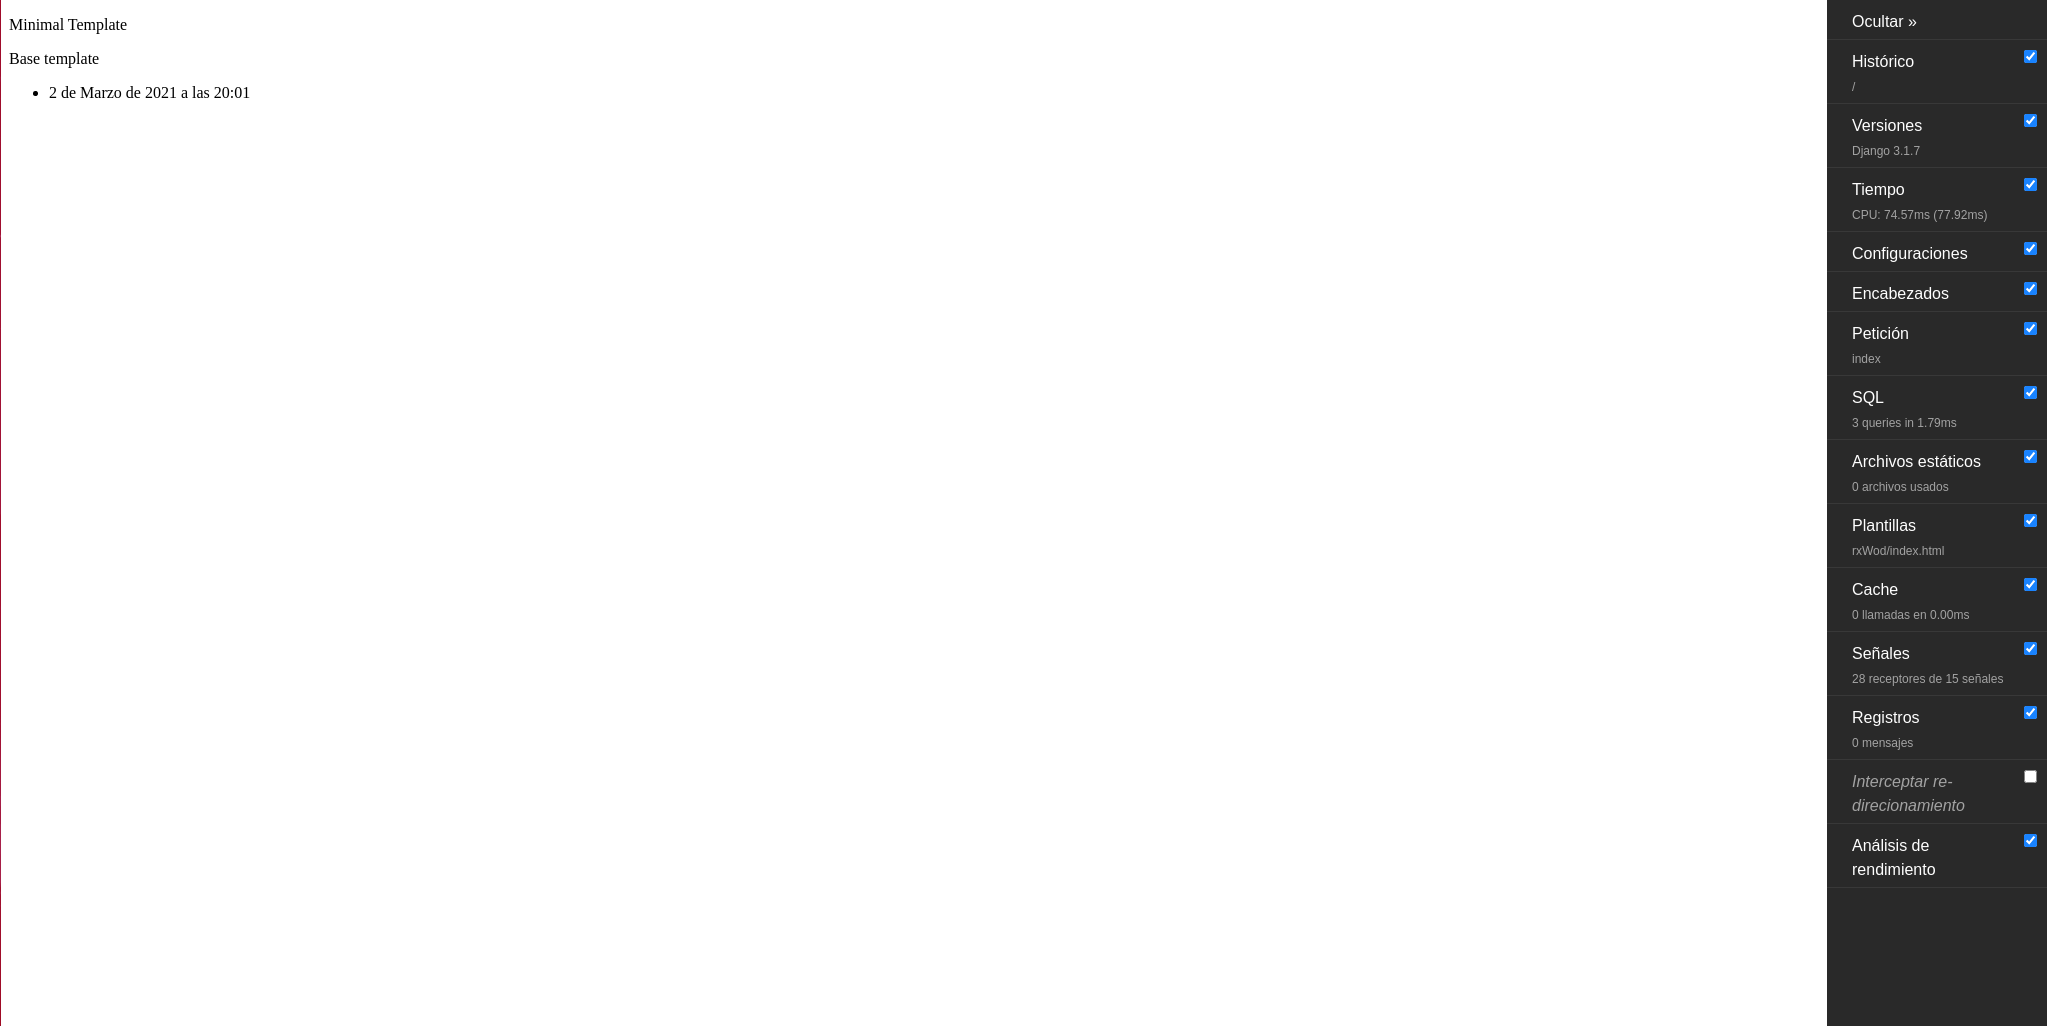
Access our App:
http://localhost:8000
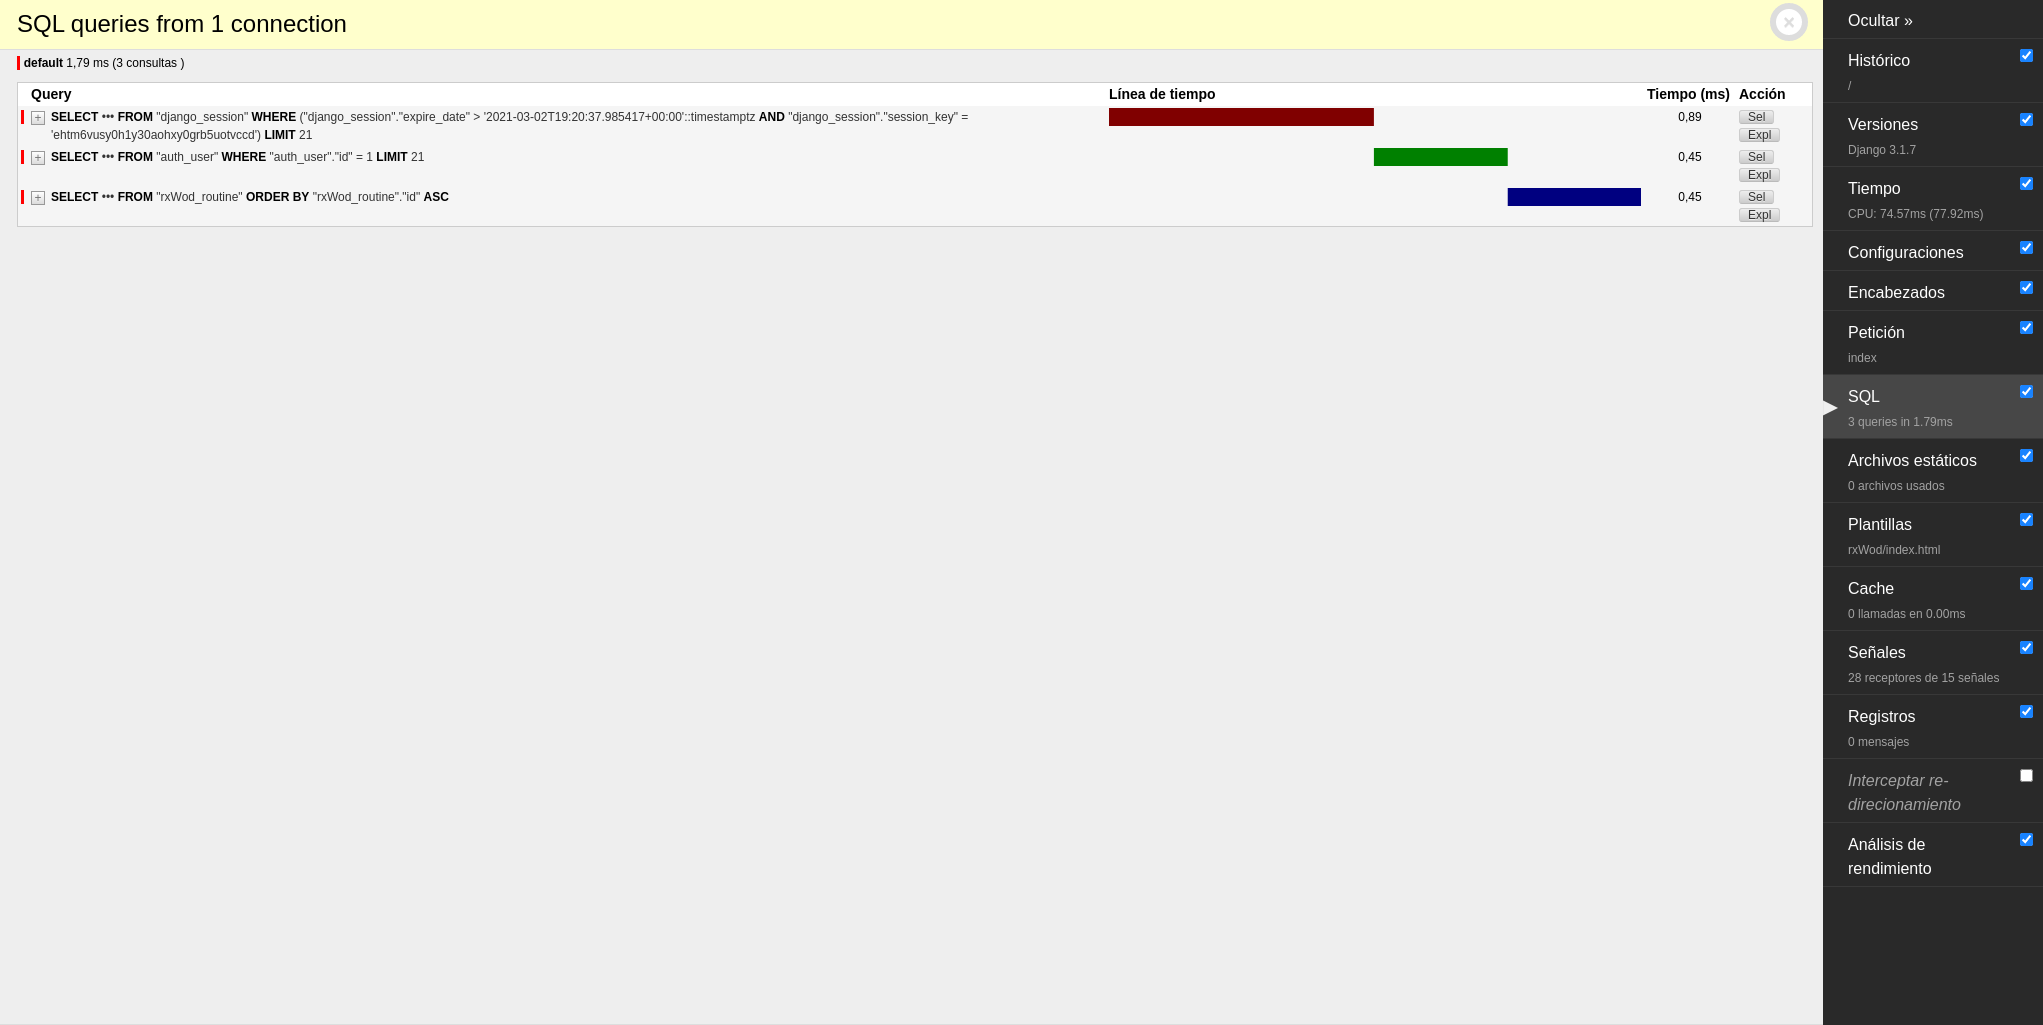
We can see a sidebar with information about SQL queries among other useful information.
The queries in detail are shown as follows: