The following article consists of several sections:
Introduction:
The initial motivation for investigating polling was a message detected in the logs of my server:
freebsd nfe0: watchdog timeout (missed Tx interrupts) -- recovering
As we can see, the
nfe
driver is reporting missed receive interrupts. The logical next step was to check if this device was sharing an IRQ with any heavily utilized I/O device, but that was not the case. The network interface had its own IRQ.
interrupt                          total       rate
irq1: atkbd0                           2          0
irq9: acpi0                          840          2
irq17: hdac0                          58          0
irq18: nfe0                            1          0
irq20: ohci0                         440          1
irq21: ehci0                        3076          7
irq22: ath0 ohci1                      2          0
irq23: ehci1                          18          0
cpu0:timer                        546025       1164
cpu1:timer                        116458        248
irq24: ahci0:ch0                   31937         68
irq25: ahci0:ch1                     341          1
Total                             699198       1490
So I decided to delve deeper into the operation and management of devices under FreeBSD. The first thing we need to consider is that in the Von Neumann architecture , I/O devices need to move data from the device itself to main memory. Each of these movements is managed by the CPU in one way or another, with several ways to perform this operation:
- Polling : The CPU checks the device’s status and proceeds with execution if there is any pending operation. For devices with low activity, this approach is very inefficient as we would be wasting clock cycles checking devices that have no pending tasks. Additionally, with polling, the probability of data loss is higher because I/O devices have limited buffers. If they are not attended to before the buffer is full, the data will be discarded.
- Interrupts: The device generates an interrupt that causes the CPU to stop what it is doing and attend to the device. This is much more efficient than polling. However, if it is a heavily loaded system, the CPU will be constantly interrupted, causing numerous context switches . As a result, more time will be spent loading and unloading data from CPU registers than processing useful information. This system degradation affects both userland and kernel processes.
- DMA: With Direct Memory Access, devices can access memory directly without depending on the CPU. They only need to be authorized by the CPU at the beginning of the operation. This makes them much faster and more efficient, as the CPU can continue its tasks without interruptions. The drawback is that not all hardware supports this mode of operation.
A interrupt-based system is more unpredictable than a polling-based system. With interrupts, events are generated when devices determine it, while with polling, devices are controlled and serviced by the operating system at the most appropriate time to avoid CPU context switches.
By using polling, we gain system responsiveness, meaning that it will remain more interactive when there is a lot of I/O. However, it will increase the latency in event processing. This latency is not a problem in most cases since devices are serviced without issues in systems with low load, and in systems with high load, the additional polling latency is negligible compared to the latency introduced by the rest of the system. This latency can be reasonably reduced by increasing the “clock interrupt frequency” of the operating system.
Polling can be interesting in systems with high I/O and short duration, such as network traffic in heavily loaded servers. In these systems, constant CPU context switching wastes many useful resources.
We must consider that the main objective of polling is not to increase performance but to increase responsiveness and avoid livelocks, which is the inability to perform useful work due to spending too much time processing packets that will eventually be discarded. This is useful in various scenarios:
- Servers that receive DoS attacks.
- Pseudo-real-time processing systems connected to the network.
Regarding network performance, the system will exhibit different behaviors depending on its configuration:
- Interrupts: Optimization of system resources as long as there is low I/O. Beyond a certain load, the system runs the risk of becoming unresponsive and requiring a complete system restart.
- Polling: Very high and stable performance regardless of the received traffic, but with the possibility of discarding traffic once a certain threshold is exceeded.
Polling Configuration:
The first step is to check if polling is not enabled. Even if we try to enable it, we won’t be able to because the GENERIC kernel does not have this option enabled:
nfe0: flags=8943<UP,BROADCAST,RUNNING,PROMISC,SIMPLEX,MULTICAST> metric 0 mtu 1500
	options=8210b<RXCSUM,TXCSUM,VLAN_MTU,TSO4,WOL_MAGIC,LINKSTATE>
	ether 00:22:19:eb:c7:e9
	media: Ethernet autoselect (1000baseT <full-duplex>)
	status: active
	nd6 options=29<PERFORMNUD,IFDISABLED,AUTO_LINKLOCAL>
We can see that the “options” line does not include POLLING:
options=8210b<RXCSUM,TXCSUM,VLAN_MTU,TSO4,WOL_MAGIC,LINKSTATE>
We try to enable it, but it remains the same:
ifconfig nfe0
nfe0: flags=8943<UP,BROADCAST,RUNNING,PROMISC,SIMPLEX,MULTICAST> metric 0 mtu 1500
	options=8210b<RXCSUM,TXCSUM,VLAN_MTU,TSO4,WOL_MAGIC,LINKSTATE>
	ether 00:22:19:eb:c7:e9
	media: Ethernet autoselect (1000baseT <full-duplex>)
	status: active
	nd6 options=29<PERFORMNUD,IFDISABLED,AUTO_LINKLOCAL>
Additionally, the kernel parameters will not be available:
sysctl: unknown oid 'kern.polling'
To enable polling, we will need to recompile the kernel. We will only add this option, the rest will be an identical copy of the GENERIC kernel.
Generate the custom configuration file:
mkdir /root/kernel_configs
touch /root/kernel_configs/KR0M
ln -s /root/kernel_configs/KR0M
Include the GENERIC configuration and add the DEVICE_POLLING option:
include GENERIC
ident KR0M

options         DEVICE_POLLING
Compile the kernel:
make -j2 buildkernel KERNCONF=KR0M INSTKERNNAME=kernel.kr0m
Copy the new kernel image and its modules to /boot/kernel.kr0m:
Adjust our loader to load the correct image:
kernel=kernel.kr0m
Restart to test the new kernel:
Check the loaded image:
FreeBSD MightyMax.alfaexploit.com 13.0-RELEASE-p11 FreeBSD 13.0-RELEASE-p11 #0 releng/13.0-n244791-312522780e8-dirty: Thu Apr 7 21:23:31 CEST 2022 root@MightyMax.alfaexploit.com:/usr/obj/usr/src/amd64.amd64/sys/KR0M amd64
With the new kernel, we can now enable polling:
nfe0: flags=8943<UP,BROADCAST,RUNNING,PROMISC,SIMPLEX,MULTICAST> metric 0 mtu 1500
	options=8210b<RXCSUM,TXCSUM,VLAN_MTU,TSO4,WOL_MAGIC,LINKSTATE>
	ether 00:22:19:eb:c7:e9
	media: Ethernet autoselect (1000baseT <full-duplex>)
	status: active
	nd6 options=29<PERFORMNUD,IFDISABLED,AUTO_LINKLOCAL>
ifconfig nfe0
nfe0: flags=8943<UP,BROADCAST,RUNNING,PROMISC,SIMPLEX,MULTICAST> metric 0 mtu 1500
	options=8214b<RXCSUM,TXCSUM,VLAN_MTU,POLLING,TSO4,WOL_MAGIC,LINKSTATE>
	ether 00:22:19:eb:c7:e9
	media: Ethernet autoselect (1000baseT <full-duplex>)
	status: active
	nd6 options=29<PERFORMNUD,IFDISABLED,AUTO_LINKLOCAL>
We can see that POLLING now appears in the options section:
options=8214b<RXCSUM,TXCSUM,VLAN_MTU,POLLING,TSO4,WOL_MAGIC,LINKSTATE>
To make polling persistent across reboots, we need to modify the network interface configuration:
ifconfig_nfe0="inet 192.168.69.2 netmask 255.255.255.0 polling up"
defaultrouter="192.168.69.200"
NOTE: If we are using a bridge, we need to keep in mind that polling should be enabled on the physical interface, not the bridge.
With the new kernel, we will have access to certain
configuration parameters
:
kern.polling.idlepoll_sleeping: 1
kern.polling.stalled: 0
kern.polling.suspect: 0
kern.polling.phase: 0
kern.polling.handlers: 0
kern.polling.residual_burst: 0
kern.polling.pending_polls: 0
kern.polling.lost_polls: 0
kern.polling.short_ticks: 0
kern.polling.reg_frac: 20
kern.polling.user_frac: 50
kern.polling.idle_poll: 0
kern.polling.each_burst: 5
kern.polling.burst_max: 150
kern.polling.burst: 5
In the presented tests, all parameters have been left with their default values. By tuning them, we could better adjust our system to reach a point where no traffic is lost but the system doesn’t hang either.
Iperf Benchmark
We install the network benchmark software:
We start the server part:
The tests will be performed with a duration of 1 hour. This way, the results are more representative than a single isolated test. Additionally, we indicate that statistics should be displayed every 1 second, so we have data in the logs every 1 second:
iperf3 -c 192.168.69.2 -t 3600 -i 1 -V --logfile POLLING.txt
To display bandwidth and retransmission data, we can use the following script:
#!/usr/bin/env bash

VALUES=$(cat $1 | grep 'Mbits/sec' | awk '{print$7" "$9}' | grep -v receiver)

rm /tmp/bandwith
rm /tmp/retransmissions

IFS=$'\n'
COUNTER=0
for VALUE in $VALUES; do
        BW_VALUE=$(echo $VALUE|awk '{print$1}')
        #echo "BW_VALUE: $BW_VALUE"
        echo "$COUNTER $BW_VALUE" >> /tmp/bandwith

        RETRANS_VALUE=$(echo $VALUE|awk '{print$2}')
        #echo "RETRANS_VALUE: $RETRANS_VALUE"
        echo "$COUNTER $RETRANS_VALUE" >> /tmp/retransmissions

        let COUNTER=$COUNTER+1
done
gnuplot -p -e "plot '/tmp/bandwith' title 'Mbits/sec' with lp; replot '/tmp/retransmissions' title 'Retransmissions' with lp"
We assign the necessary permissions and execute it. The script will take a while since there is a lot of data and bash is not particularly fast:
./iperfGraph.sh GENERIC.txt
./iperfGraph.sh POLLING.txt
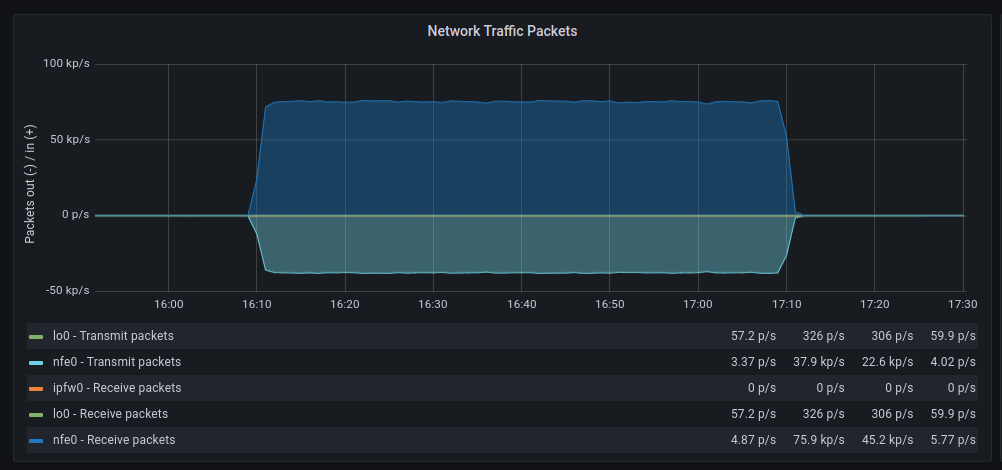
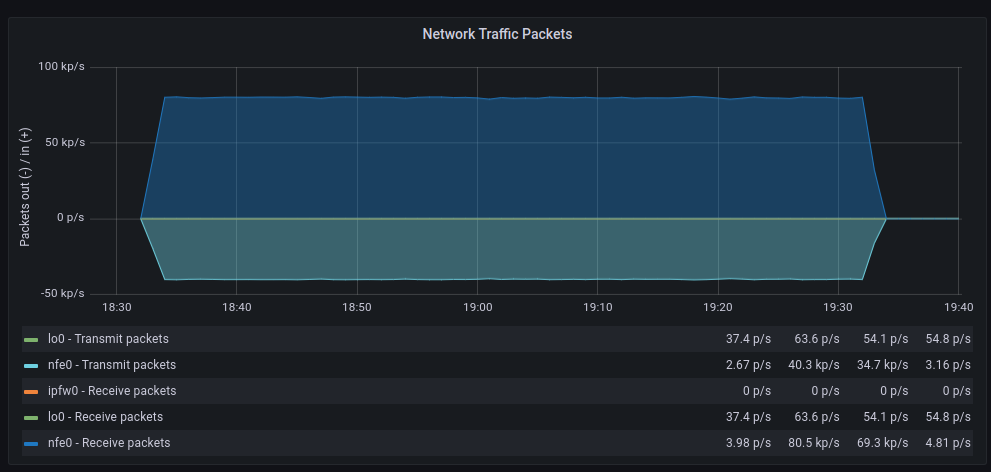
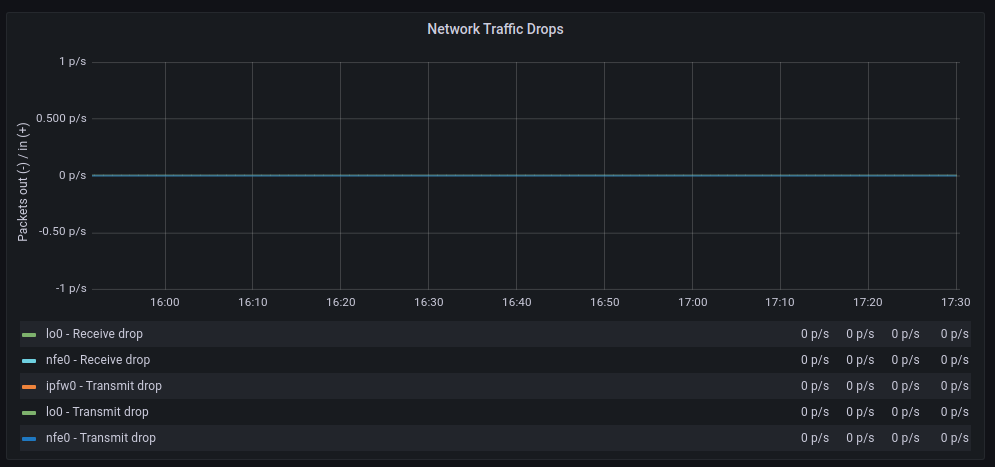
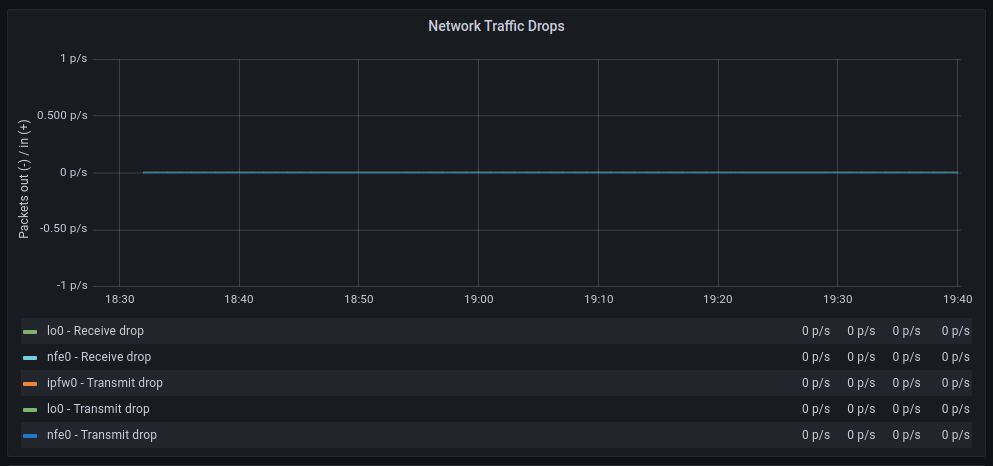
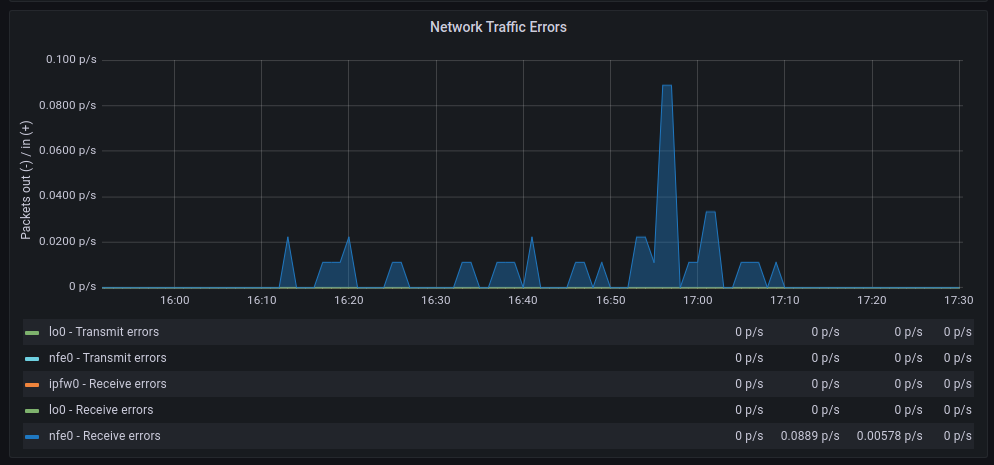
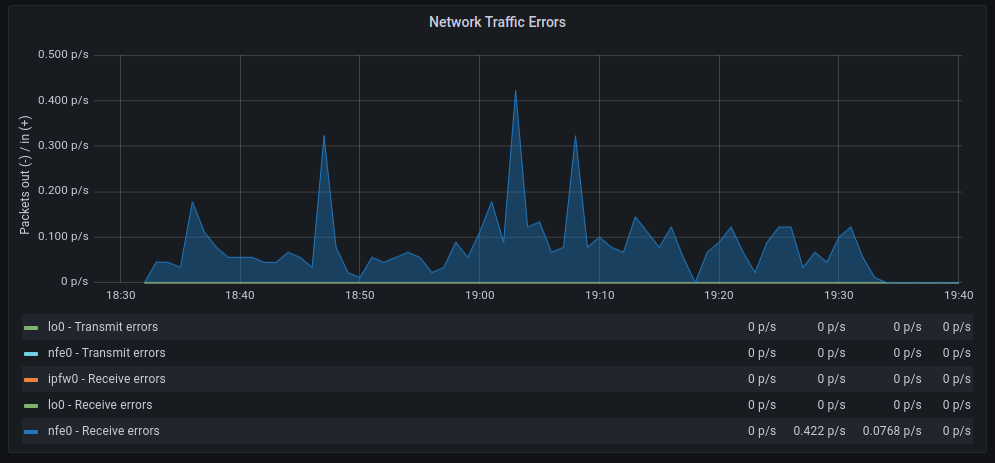
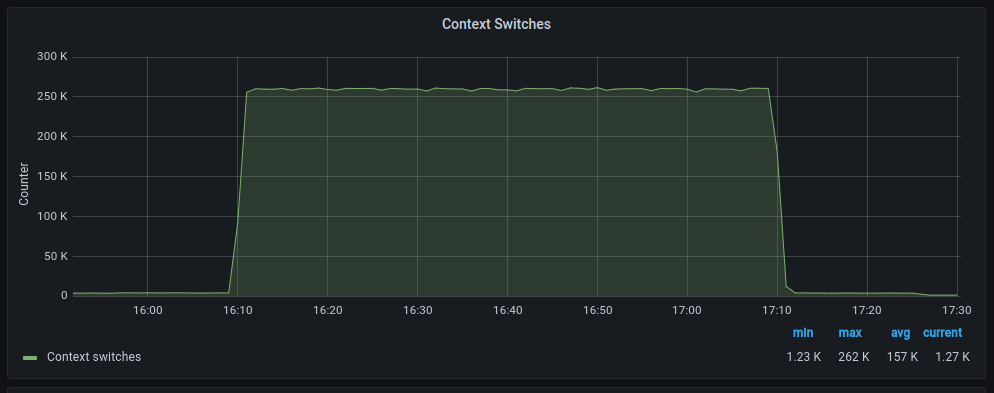
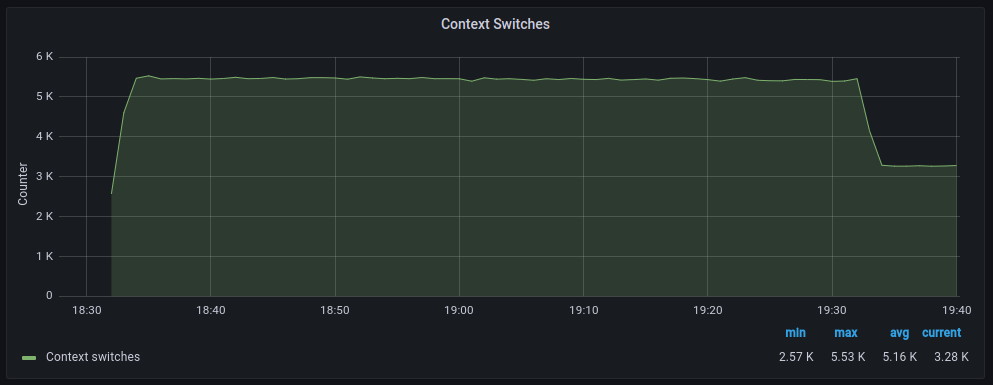
To get a broader view, we will also consult the metrics from our Prometheus:
| GENERIC | POLLING |
|---|---|
|
|
|
|
|
|
|
|
The average transfer rates are very similar, although with polling, there seem to be more retransmissions. As for discarded packets, the behavior is very similar. However, errors increase significantly when polling is used. On the other hand, context switches decrease drastically, as expected.
Conclusion
Polling works well when applied to systems with a heavy load, but the polling parameters must be adjusted to reach a point where no traffic is discarded without hanging the system. It is about finding the perfect balance between device polling time and the time spent on kernel+userland. Each system has specific network drivers, a specific load, and specific requirements. Therefore, the only way to find that point is through experimentation. Once the system is tuned, it might be interesting to configure alerts when a certain threshold of traffic discarding is exceeded on the server. This would be a good indicator that we need to add more nodes to the server cluster.
My quick recommendation is:
- Interrupts: Servers with low/medium traffic volume, interrupts will not be a problem and you will have 100% CPU power available for local processes.
- Polling: Servers with high traffic where we experience hangs using interrupts, we will gain in stability but we will not have 100% CPU power available for local processes since polling will consume part of it.