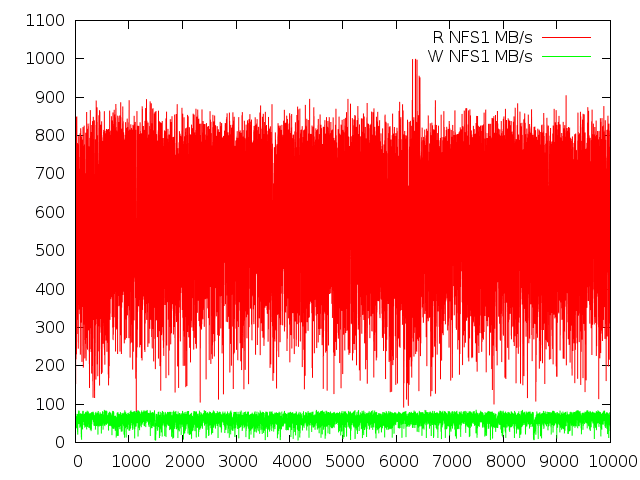
There are times when we need to quickly determine the performance that a directory imported by NFS can achieve, or we want to compare two NFS servers.
In this article, I am publishing a script based on dd that writes files of random sizes and saves the speed results in a file that we will later represent using gnuplot.
What we will do is generate 10k files with sizes ranging from 1-4Mb. By knowing the bytes sent in a certain time, we can calculate the transfer speed and generate graphs with the obtained data.
The script in question is as follows:
#! /bin/bash
clear

echo -e " "
echo -e "---------------------------------------------------------------"
echo -e "| Script NFS test, generates random sized files between 1-4Mb |"
echo -e "---------------------------------------------------------------"
echo -e " "

echo -e "-- Introduzca la ruta del directorio compartido por NFS:"
read RUTA
echo -e " "

echo -e "-- Introduzca nombre identificativo del servidor NFS:"
read NAME
echo -e " "

echo -e "-- Creando directorio de prueba"
rm -rf $RUTA/nfs_test 2>/dev/null
mkdir $RUTA/nfs_test 2>/dev/null

i=0

> /tmp/nfs_$NAME'.dat'

while [ $i -lt 10000 ]
do
    #echo -e "i: $i"
    RAND=$[RANDOM%4+1]
    echo -e " "

    echo -e "++ Generando fichero $i con tamanyo $RAND"
    WBYTES_SECONDS=$(dd if=/dev/zero of=$RUTA/nfs_test/$i bs=1M count=$RAND 2>&1|grep bytes|awk -F " "           '{print$1":"$6}')
    #echo -e "WBYTES_SECONDS: $WBYTES_SECONDS"
    WBYTES=$(echo $WBYTES_SECONDS|awk -F ":" '{print$1}')
    #echo -e "WBYTES: $WBYTES"
    WSEC=$(echo $WBYTES_SECONDS|awk -F ":" '{print$2}')
    #echo -e "WSECONDS: $WSEC"
    WMBps=$(echo "scale=10;$WBYTES/$WSEC/1024/1024" | bc)

    echo -e "++ Leyendo fichero $i"
    RBYTES_SECONDS=$(dd if=$RUTA/nfs_test/$i of=/dev/zero 2>&1|grep bytes|awk -F " " '{print$1":"$6}')
    #echo -e "RBYTES_SECONDS: $RBYTES_SECONDS"
    RBYTES=$(echo $RBYTES_SECONDS|awk -F ":" '{print$1}')
    #echo -e "RBYTES: $RBYTES"
    RSEC=$(echo $RBYTES_SECONDS|awk -F ":" '{print$2}')
    #echo -e "RSECONDS: $RSEC"
    RMBps=$(echo "scale=10;$RBYTES/$RSEC/1024/1024" | bc)

    echo -e "$RMBps $WMBps" >> /tmp/nfs_$NAME'.dat'

    echo -e "-- R-Speed: $RMBps MB/s"
    echo -e "-- W-Speed: $WMBps MB/s"

    echo -e "++ Borrando fichero"
    rm $RUTA/nfs_test/$i
    i=$(( $i + 1 ))
done

echo -e "-- Eliminando directorio de prueba"
rm -rf $RUTA/nfs_test 2>/dev/null
If we want to compare two NFS servers, we can plot the output of the files to see the difference graphically:
sci-visualization/gnuplot X cairo gd qt4 readline wxwidgets -aqua bitmap -doc -examples -ggi -latex -lua plotutils svga -thin-splines
emerge -av sci-visualization/gnuplot
gnuplot
gnuplot> set terminal png
gnuplot> set output “nfs_read.png”
gnuplot> plot “nfs_server1.dat” using 1 w lines title ‘R NFS1 MB/s’, “nfs_server2.dat” using 1 w lines title ‘R NFS2 MB/s’
gnuplot> set terminal png
gnuplot> set output “nfs_write.png”
gnuplot> plot “nfs_server1.dat” using 2 w lines title ‘W NFS1 MB/s’, “nfs_server2.dat” using 2 w lines title ‘W NFS2 MB/s’
gnuplot> set terminal png
gnuplot> set output “nfs1.png”
gnuplot> plot “nfs_server1.dat” using 1 w lines title ‘R NFS1 MB/s’, “nfs_server1.dat” using 2 w lines title ‘W NFS1 MB/s’
With these graphs, we can see the performance of both read and write operations for a specific server and compare the reads and writes on the two servers. Some of the generated graphs are like this:

