jMeter is an Apache project aimed at load testing. With it, we can analyze and measure the performance of a variety of services such as databases, FTP, LDAP, web services, JMS, HTTP, and generic TCP connections.
In this tutorial, we will perform a web performance test using the Selenium/Webdriver plugin, which allows us to launch real browser instances against our server.
jMeter requires Java, so we install the JRE:
We download jMeter and extract it:
tar xvzf apache-jmeter-5.2.1.tgz
If we have a 4k monitor, we must change the DPI to be able to see the interface decently:
jmeter.hidpi.mode=true
jmeter.hidpi.scale.factor=2.0
jmeter.toolbar.icons.size=48x48
jmeter.tree.icons.size=48x48
jsyntaxtextarea.font.family=Hack
jsyntaxtextarea.font.size=28
language=en
I have also changed the theme:
We download the plugin manager:
wget https://jmeter-plugins.org/get/ -O jmeter-plugins-manager-1.3.jar
We start jMeter:
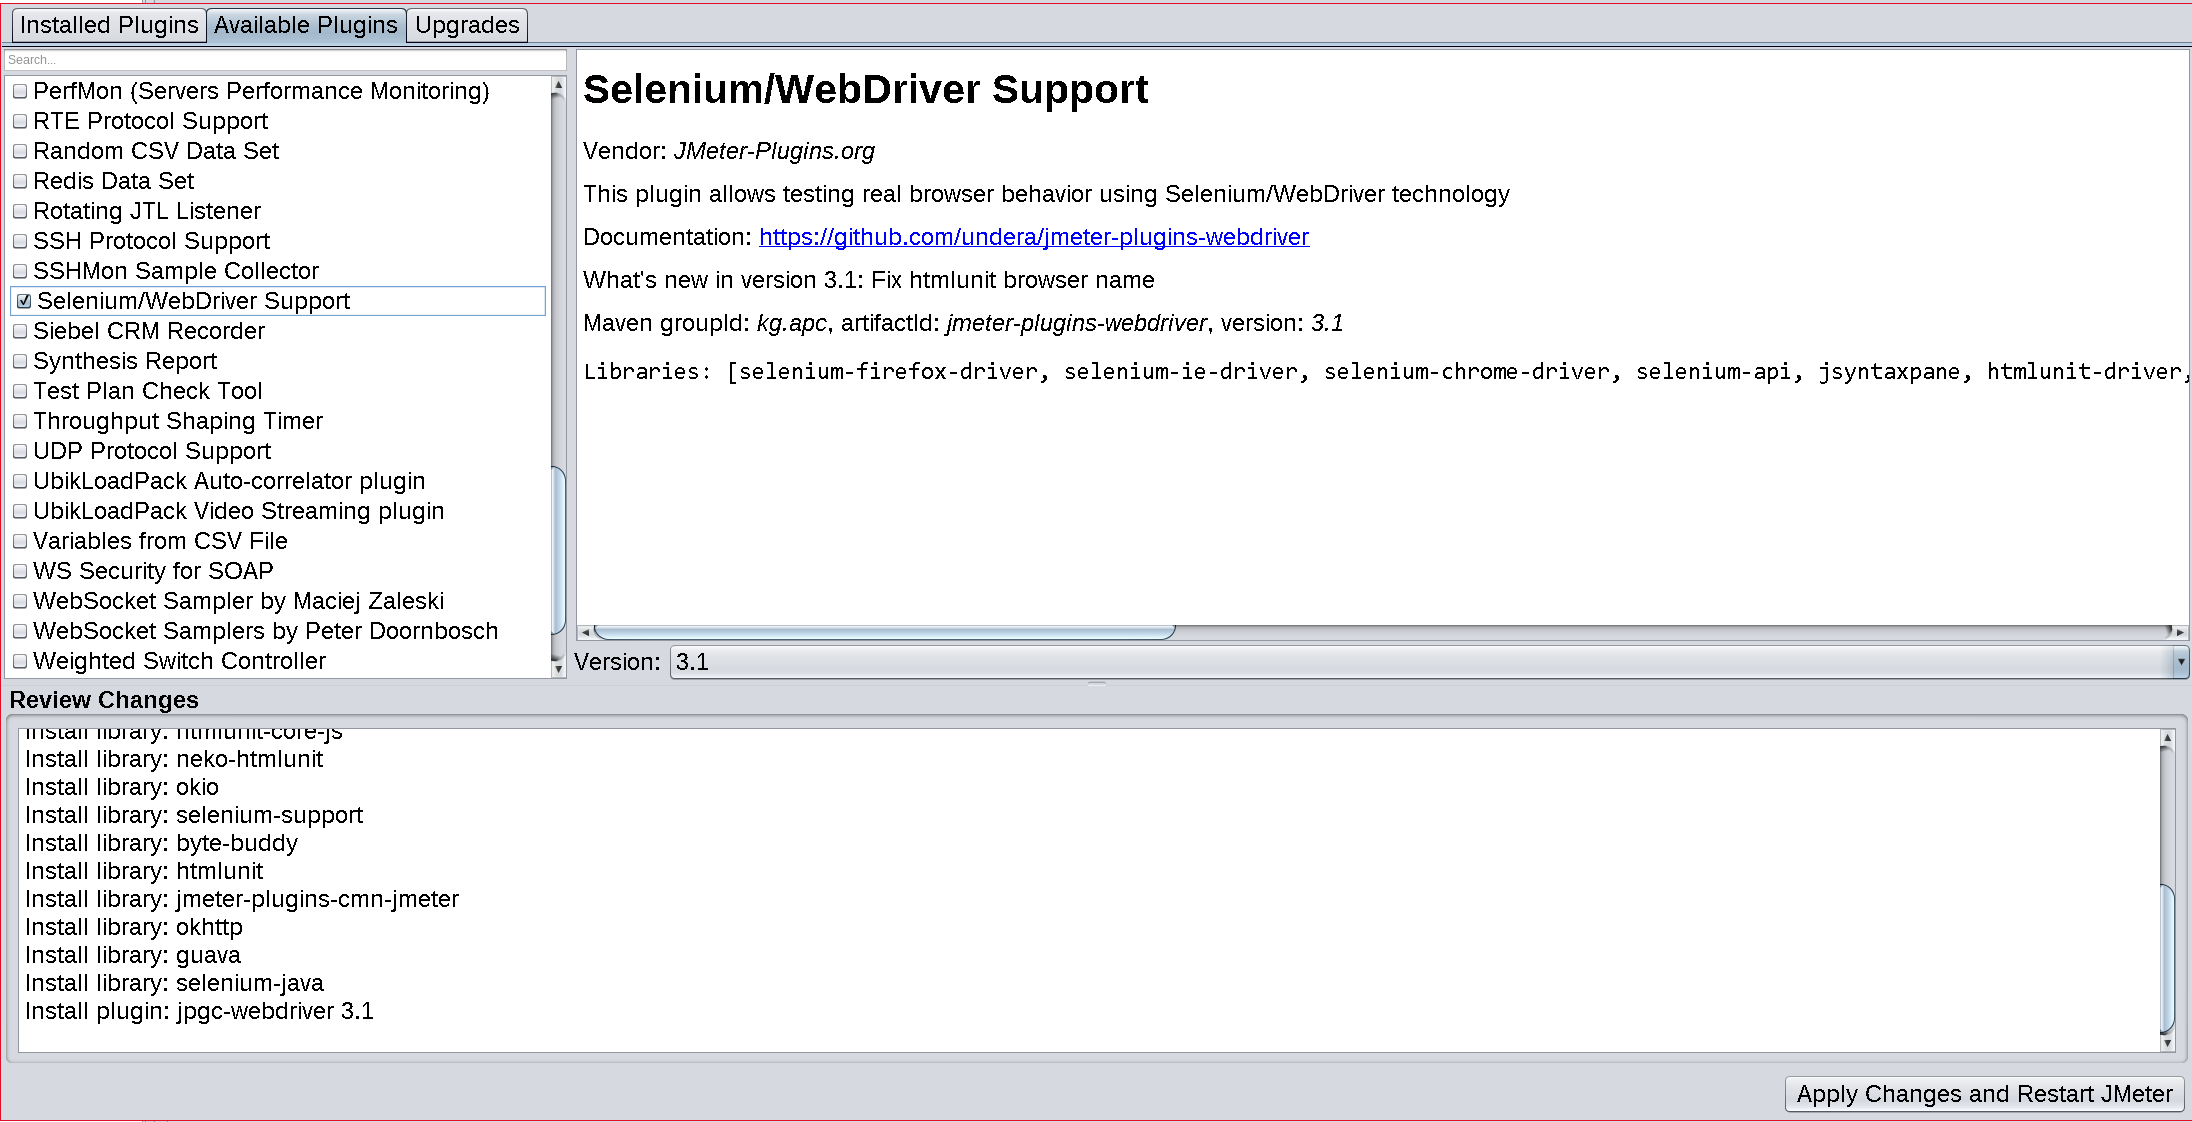
We install the Selenium/Webdriver plugin:
Selenium/Webdriver Support
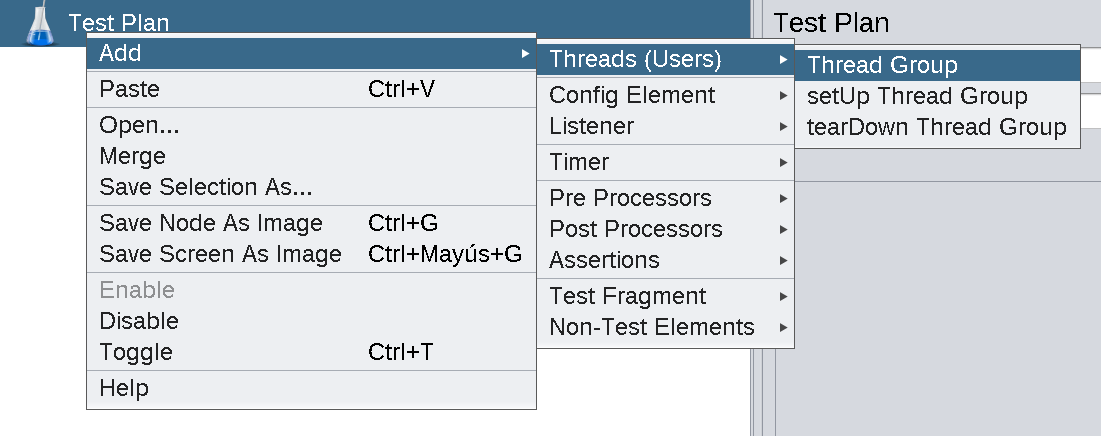
The first step will be to add a thread group to our test plan:
Add -> Threads (Users) -> Thread Group
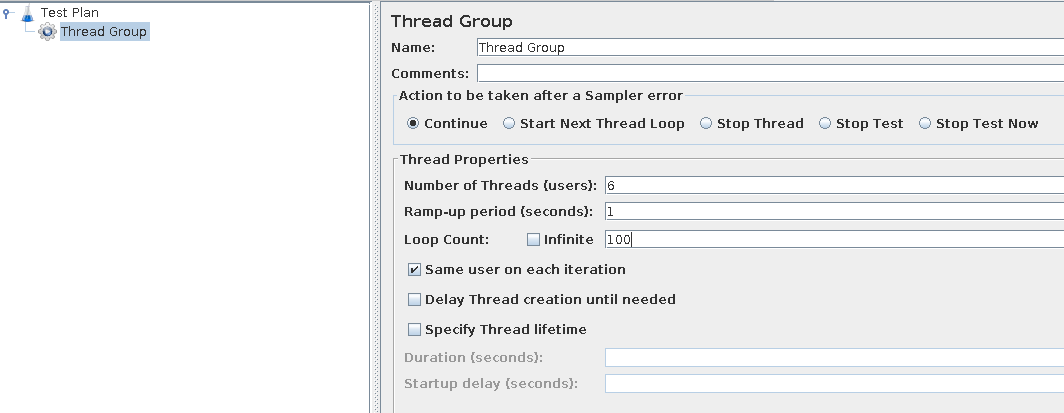
We configure 6 threads with a ramp-up of 1 and a loop count of 100. This way, we will start 1 browser every second until we reach 6 and generate a total of 600 requests.
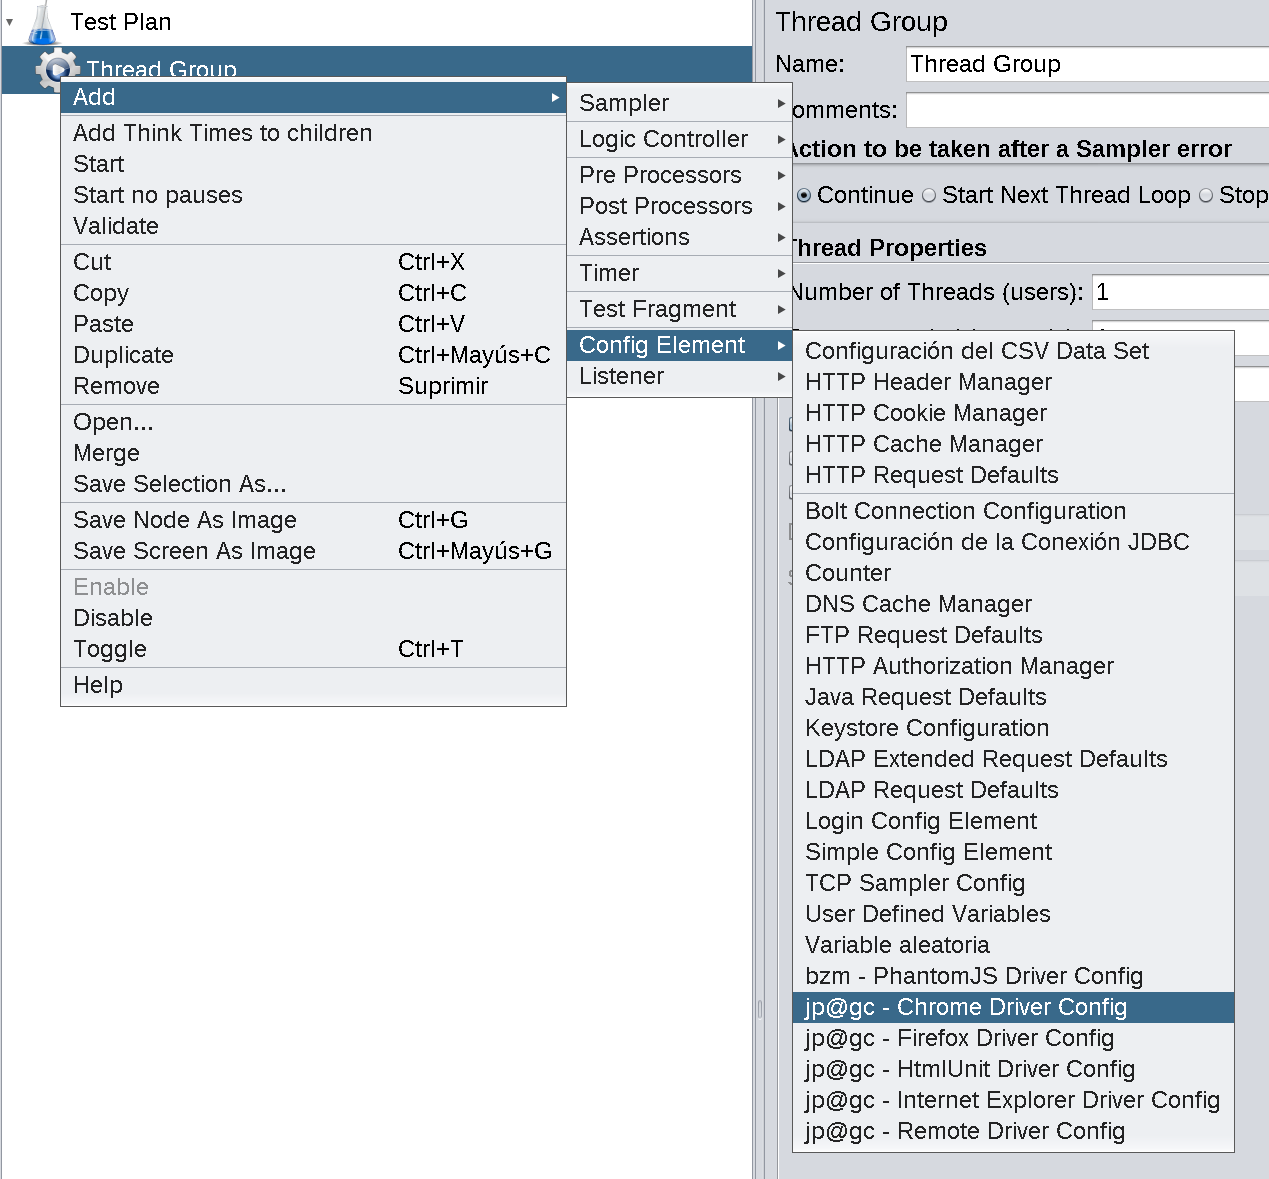
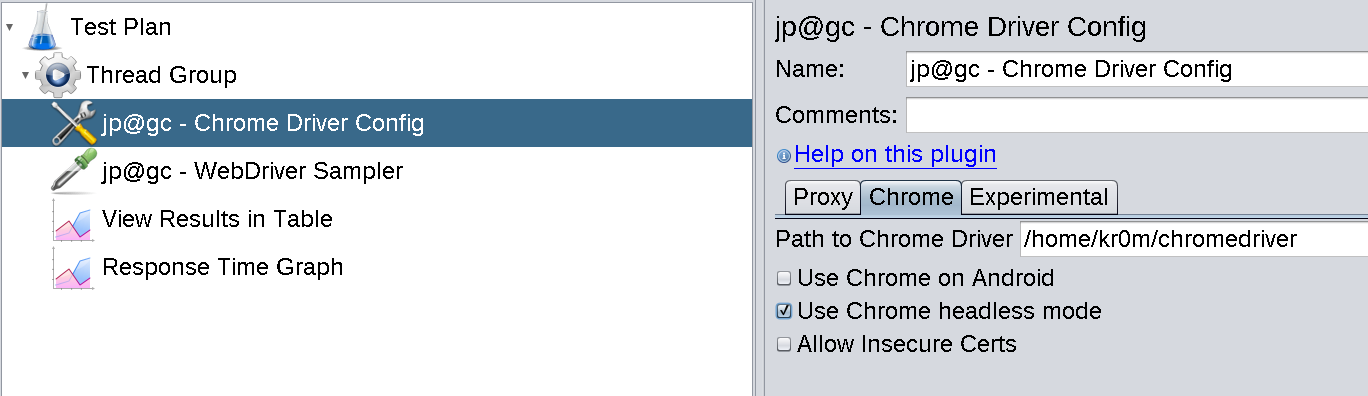
Depending on the web browser we want to test, we will configure a specific driver. I have chosen to use Chrome, so we will add a Chrome Driver Config.
Add -> Config Element -> jp@gc - Chrome Driver Config
Install Chrome:
Download the corresponding Chrome driver for the installed version of Chrome (in my case: 80.0.3987.132):
unzip chromedriver_linux64.zip
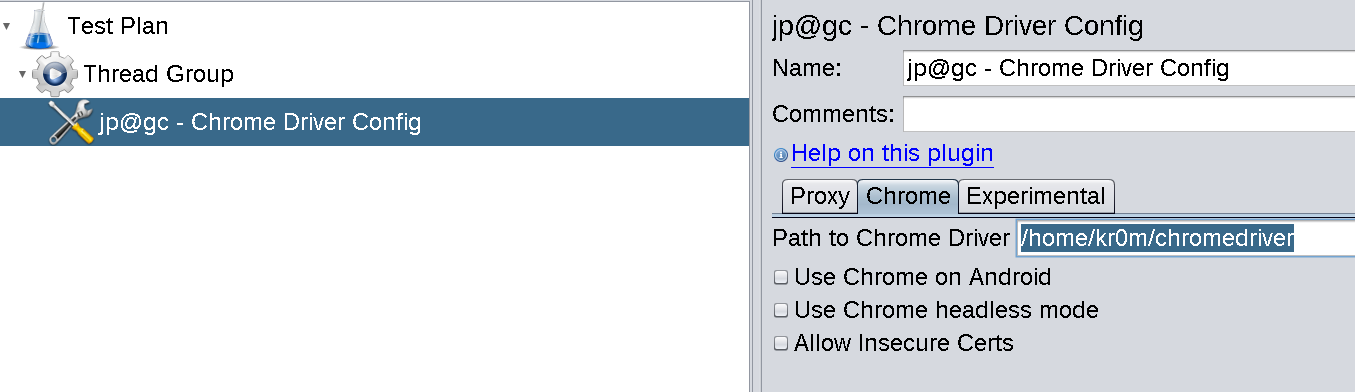
Tell jMeter where to find the Chrome driver:
Go to the Chrome tab and indicate the path of the chromeDriver
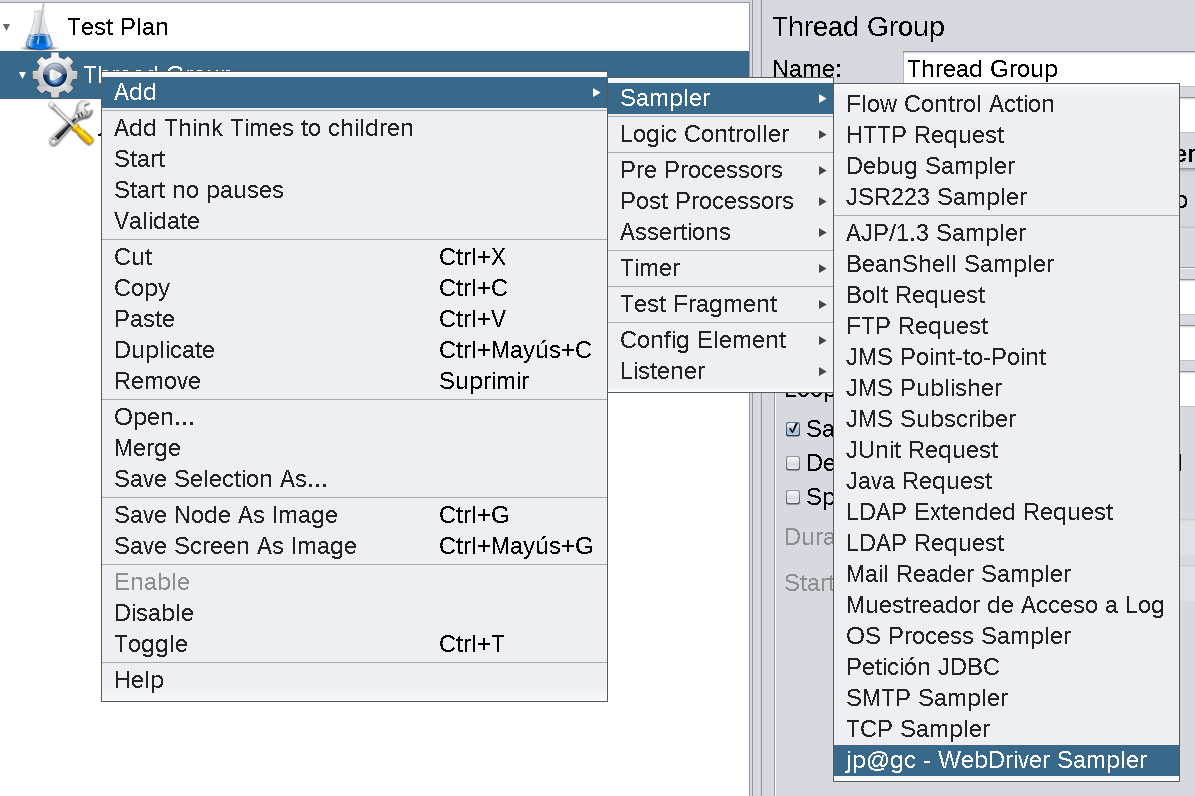
Now we have all the configuration, but we still need to tell jMeter which test we want to perform:
Add -> Sampler -> jp@gc - WebDriver Sampler
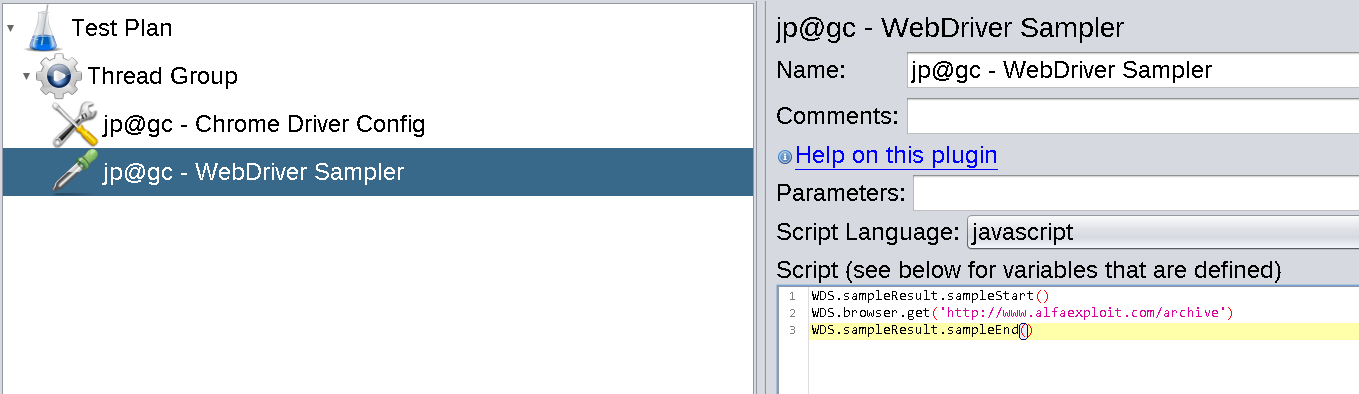
Leave the scripting language as javascript and paste the following code:
WDS.browser.get(‘ http://www.alfaexploit.com/archive' )
WDS.sampleResult.sampleEnd()
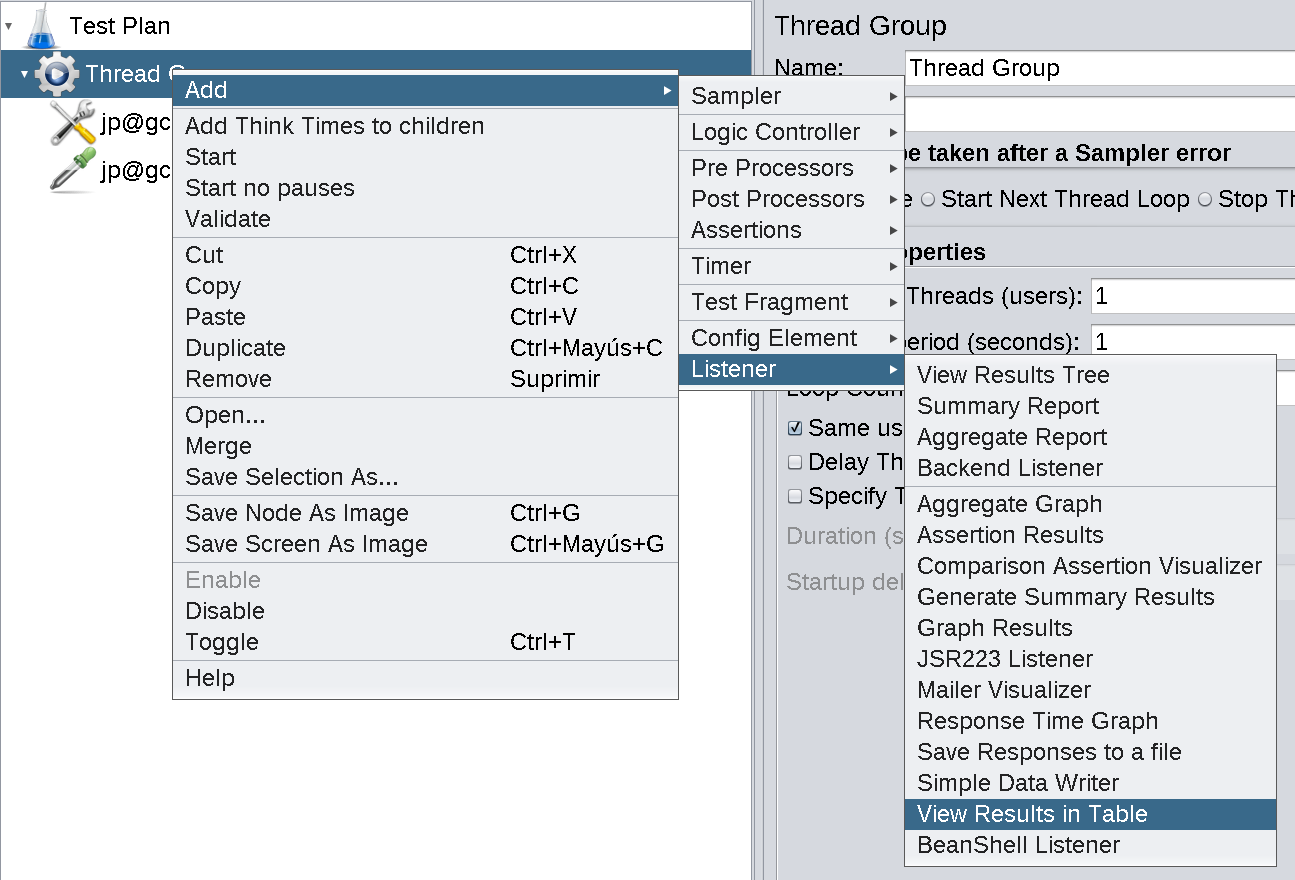
The next step is to add some listeners, which are used to visualize the test results. We will add two, one in table format and one in graph format:
Add -> Listener -> View Results In Table
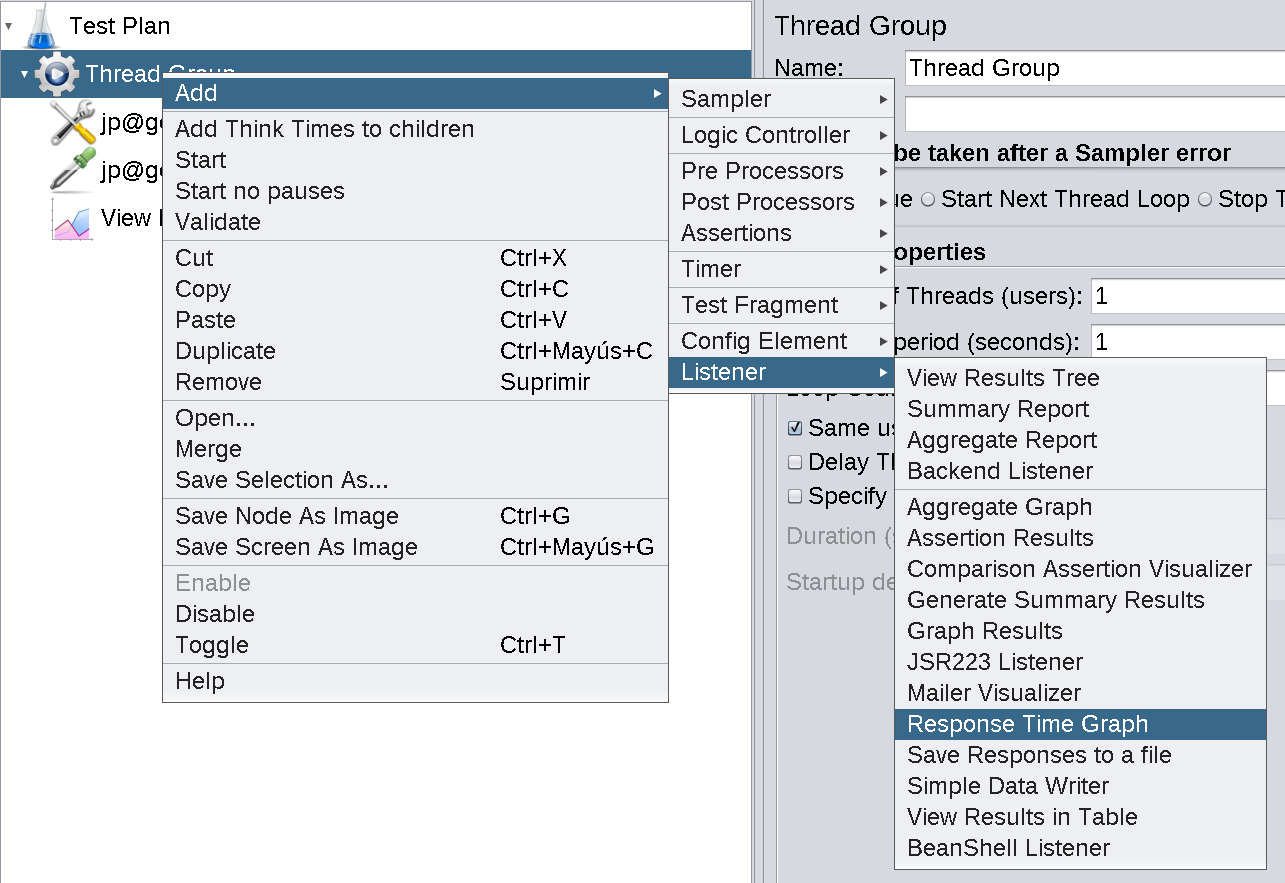
Now the graph listener:
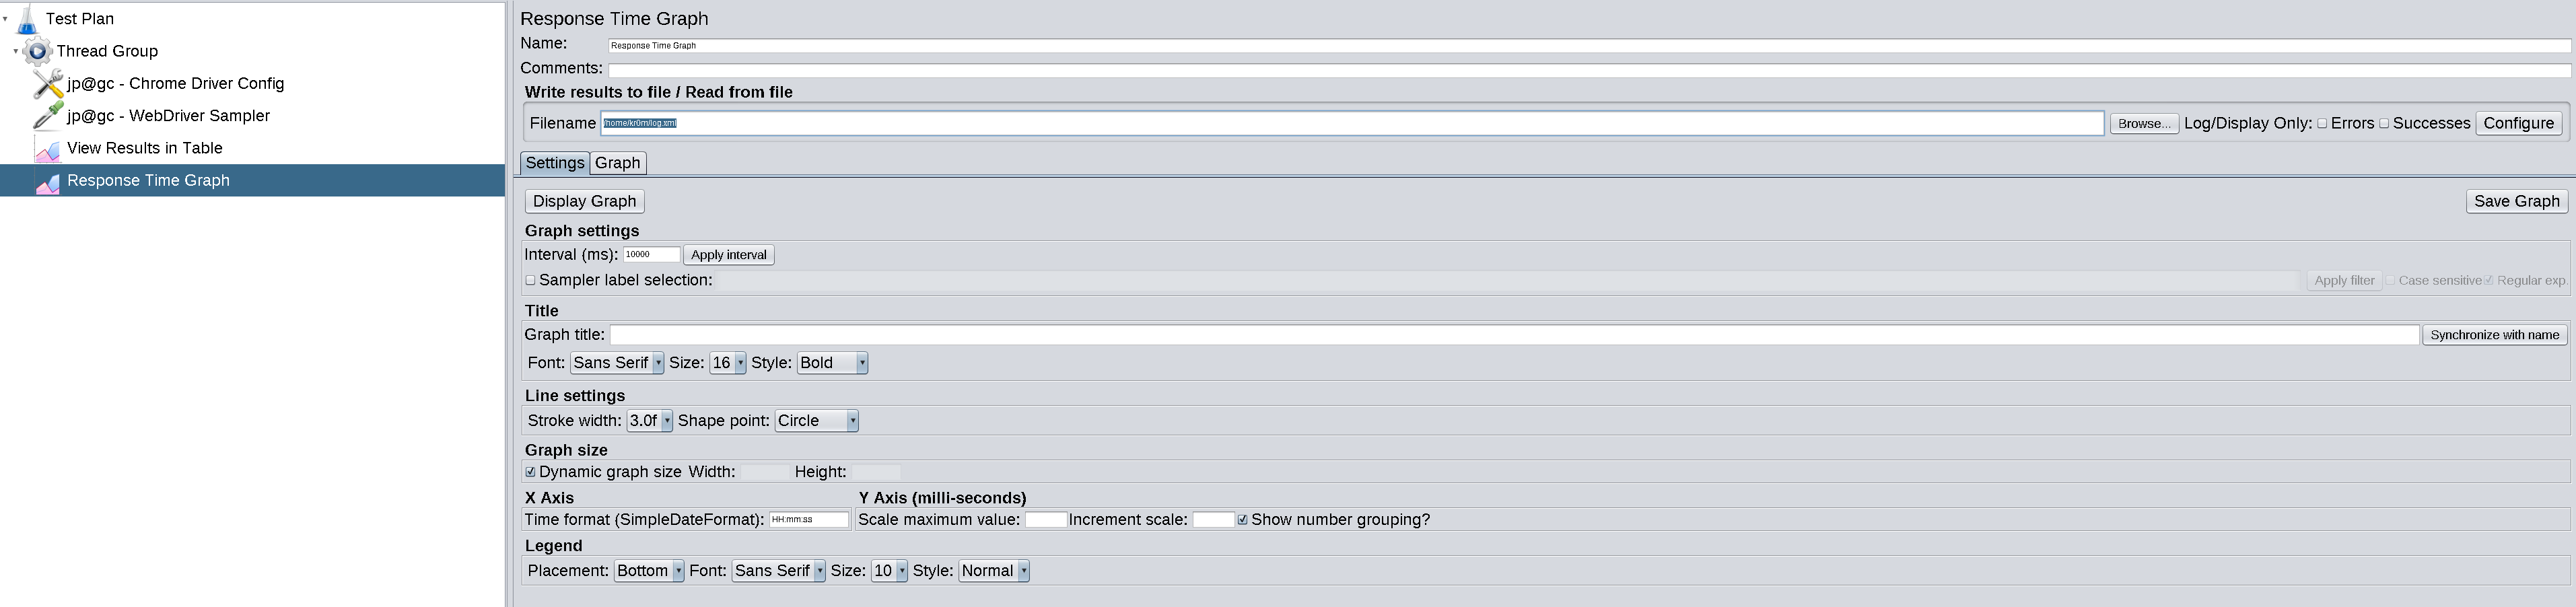
Add -> Listener -> Response Time Graph
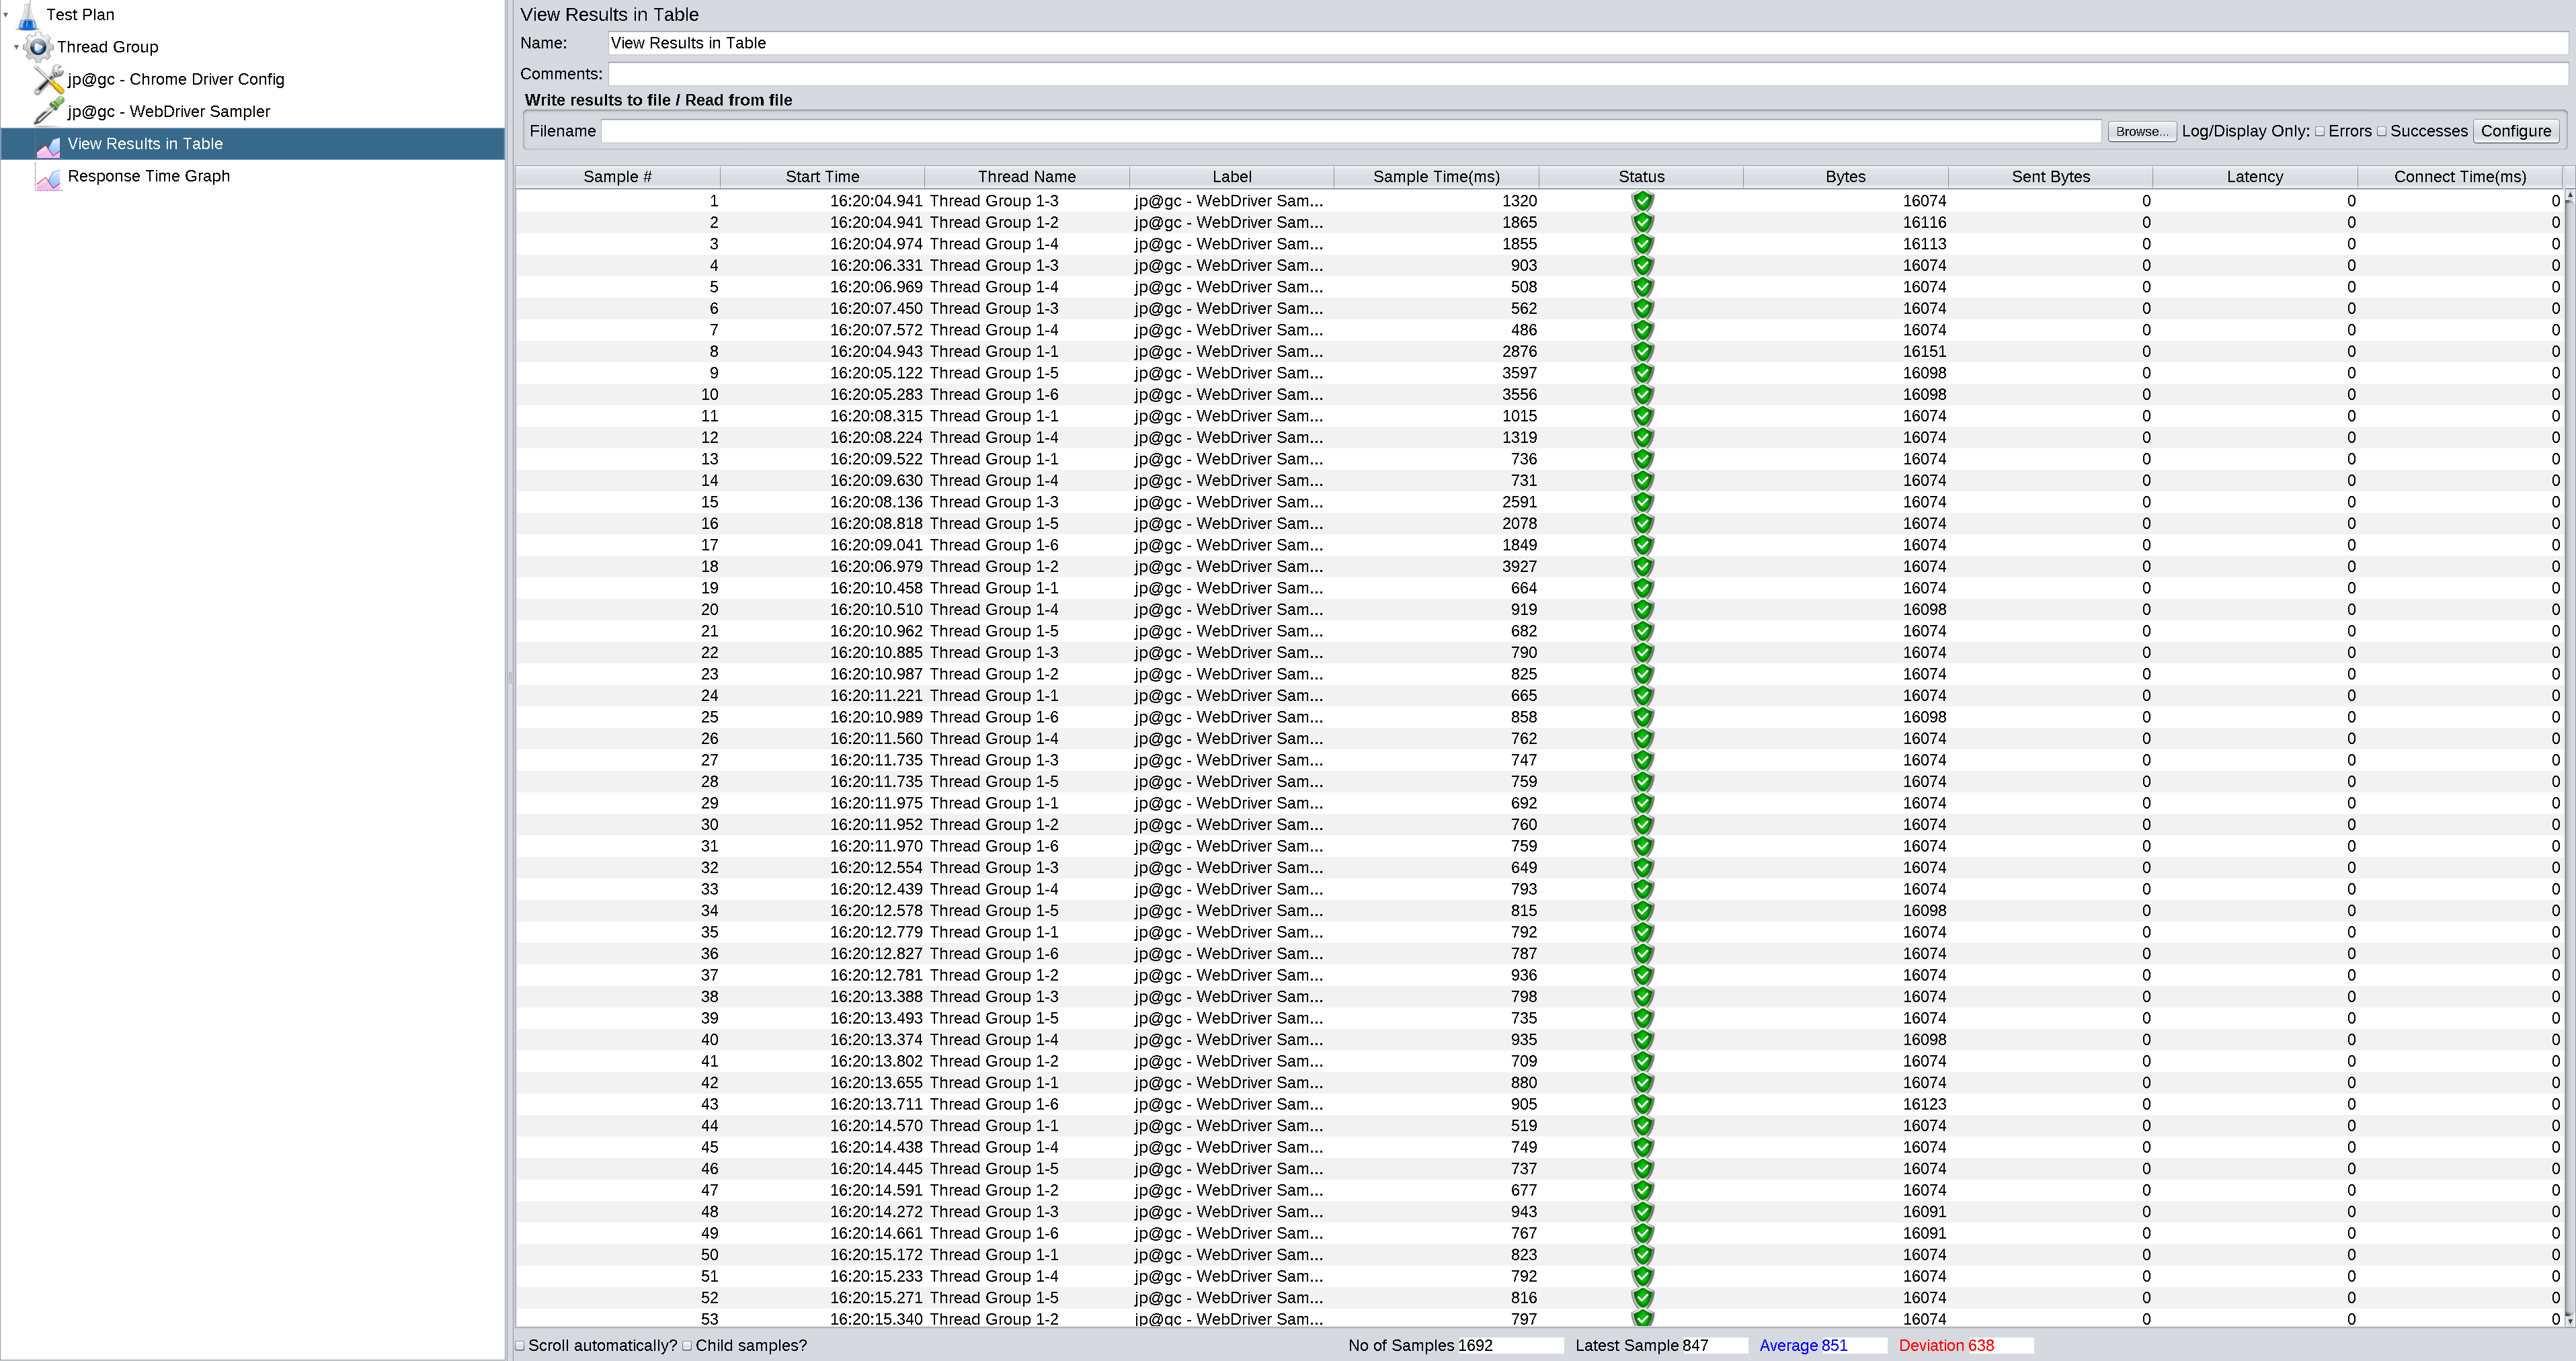
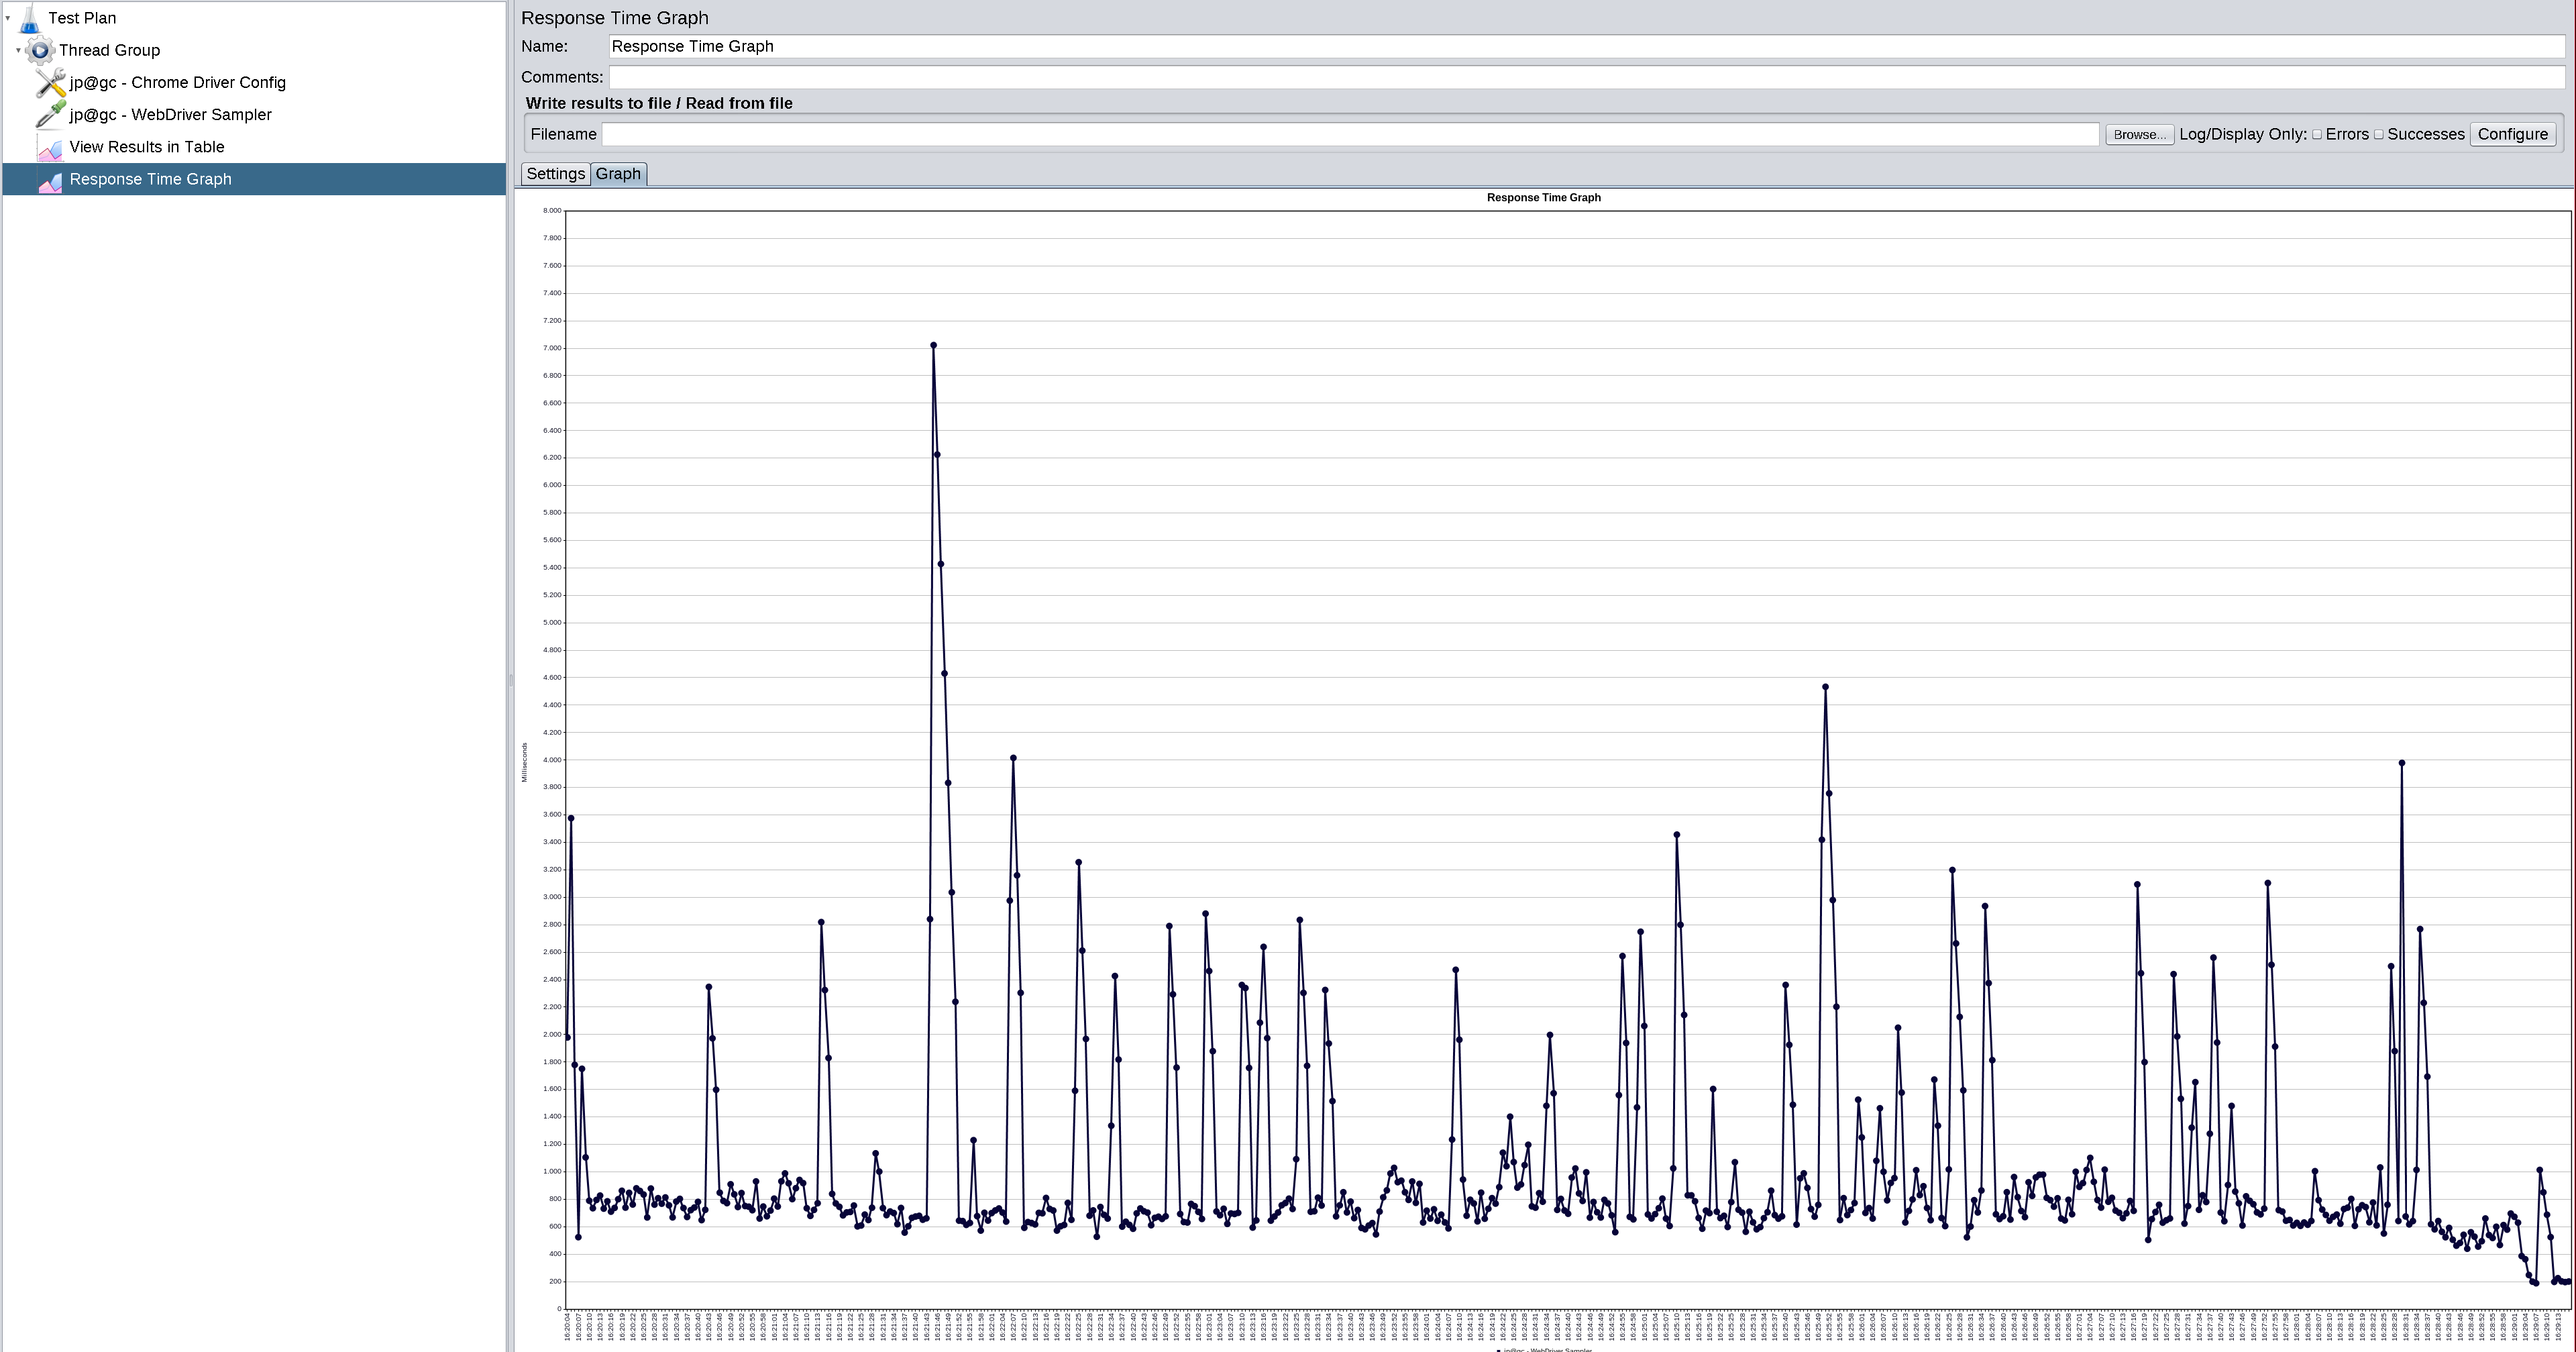
Click on the Start button (green Play button) and it will start making requests through 6 Chrome browsers in parallel.
When finished, we can see the results in the two listeners:
To properly adjust the thread parameters, we must take into account:
- Number of Threads (users): The number of users that jMeter will try to simulate.
- Ramp-Up Period (in seconds): The duration of the time during which jMeter will distribute the start of the threads.
- Loop Count: Number of times the test should be executed.
If we have 10 threads and a ramp-up period of 100s, jMeter will take 100s to start the 10 threads, each thread will start every 100/10s.
Be careful not to exceed the number of threads because they consume many resources, especially CPU. With 10 threads, my computer behaves like this:

The graphical interface can penalize the test results. To avoid this problem, we can run jMeter by CLI, but first, we must configure the Chrome Driver in headless mode:
And define which data to save in the log file:
jmeter.save.saveservice.output_format=xml
jmeter.save.saveservice.data_type=true
jmeter.save.saveservice.label=true
jmeter.save.saveservice.response_code=true
jmeter.save.saveservice.response_data=true
jmeter.save.saveservice.response_data.on_error=true
jmeter.save.saveservice.response_message=true
jmeter.save.saveservice.successful=true
jmeter.save.saveservice.thread_name=true
jmeter.save.saveservice.time=true
jmeter.save.saveservice.subresults=true
jmeter.save.saveservice.assertions=true
jmeter.save.saveservice.latency=true
jmeter.save.saveservice.connect_time=true
jmeter.save.saveservice.samplerData=true
jmeter.save.saveservice.responseHeaders=true
jmeter.save.saveservice.requestHeaders=true
jmeter.save.saveservice.encoding=true
jmeter.save.saveservice.bytes=true
jmeter.save.saveservice.sent_bytes=true
jmeter.save.saveservice.url=true
jmeter.save.saveservice.filename=true
jmeter.save.saveservice.hostname=true
jmeter.save.saveservice.thread_counts=true
jmeter.save.saveservice.sample_count=true
jmeter.save.saveservice.idle_time=true
Finally, we launch jMeter, we must keep in mind that it is NOT possible to launch it as root since Chrome headless requires the –no-sandbox parameter. In my case, I launch it with the user kr0m.
We run the test:
We can read the data obtained through one of the listeners, we just need to open the Alfaexploit.jmx file with jMeter and load the log file in the listener:
- DEBUG:
Make sure that all processes are started with the user we use to run the tests. If we try to run them with the root user, they will fail.
We can run the tests in debug mode:
JMETER_HOME/bin/jmeter -n -t Alfaexploit.jmx -l log.xml -Dsun.rmi.loader.logLevel=verbose
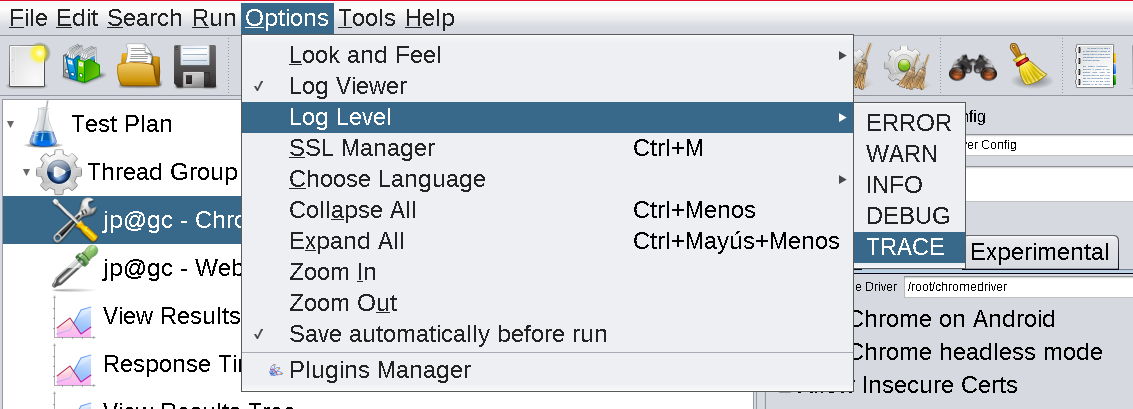
If we want to enable debug mode when running tests from the graphical interface, we must enable the desired level in the test itself: